If you’re shopping for an EV in South Africa in 2026, one of your first questions is probably: “What will it actually cost me to charge this thing?” The honest answer is that it depends heavily on where you live — and the Cape Town vs Johannesburg split is more nuanced than most people expect. For a BYD Atto 3 (16.5 kWh/100 km) driven 25,000 km/year, charging purely off-peak at home costs roughly R7,796/year in Cape Town versus R7,219/year in Johannesburg — a R577/year difference that sounds marginal until you layer in solar, public infrastructure, and mixed charging patterns. Then the gap gets interesting.
Cape Town and Johannesburg have completely different electricity tariff structures, solar adoption rates, and public charging networks. Cape Town’s 2025/26 electricity tariffs mark the city’s most sweeping pricing overhaul in decades, with the municipality constraining its average price hike to 9.32% — below Eskom’s 11.32% bulk-supply rise — while unbundling hidden cross-subsidies that had distorted household bills for years. Johannesburg, meanwhile, implemented new electricity tariff increases through City Power, as approved by NERSA, with an average increase of 12.41% across City Power’s customer categories for the 2025/2026 financial year. That foundational difference shapes every rand you spend charging your EV.
This comparison digs into the real numbers: home charging tariffs, public charging networks, solar synergy, load-shedding impact, and which city gives EV owners the genuine advantage in 2026. We compare the City of Cape Town (CoCT) against City Power Johannesburg across five key dimensions — because the right answer depends entirely on your driver profile.
The Electricity Tariff Showdown: CoCT vs City Power
Let’s get the numbers on the table first. On a like-for-like 656 kWh monthly basket, Cape Town costs approximately R2,430 versus Johannesburg’s R2,700 — which means Cape Town is actually the cheaper municipality overall, once you account for the full tariff structure. But for EV charging specifically, the time-of-use pattern matters more than the headline rate, and here Johannesburg holds a consistent advantage across all charging scenarios.
In South Africa, electricity rates for home charging range between R1.80 and R4.00/kWh depending on the city and usage tier. Cape Town residents pay between R1.80 and R3.20/kWh, depending on consumption block and time of use. Johannesburg’s City Power structure is broadly similar, with Block 1 (0–350 kWh) priced at approximately R2.6645/kWh. For EV owners on a Domestic tariff consuming significant electricity, the relevant comparison is in the upper blocks and time-of-use tiers.
Here’s what the comparison actually looks like for a typical middle-income homeowner with a credit meter, driving a BYD Atto 3 at 25,000 km/year (consuming 4,125 kWh annually just for the car):
| Tariff Type | Cape Town (CoCT) | Johannesburg (City Power) | Cheaper City |
|---|---|---|---|
| Standard residential (avg) | R3.18/kWh | R2.95/kWh | Johannesburg |
| Off-peak rate (night) | R1.89/kWh | R1.75/kWh | Johannesburg |
| Peak rate (morning/evening) | R4.47/kWh | R4.12/kWh | Johannesburg |
| Annual cost (off-peak only) | R7,796/year | R7,219/year | Johannesburg (saves R577) |
| Annual cost (70% off-peak, 30% standard) | R9,405/year | R8,704/year | Johannesburg (saves R701) |
| Cost per km (off-peak) | R0.31/km | R0.29/km | Johannesburg |
The key insight is that Johannesburg is R0.14/kWh cheaper for off-peak charging. For pure off-peak charging — which most EV owners with a wallbox and a timer will achieve — Johannesburg is 7–9% cheaper. Mixed charging narrows the gap slightly but Joburg still wins. The one variable that flips this verdict completely is solar. But we’ll get to that.
Want to run the numbers for your specific driving pattern? Calculate your exact charging costs for your city using our EV savings calculator — plug in your annual kilometres, municipality, and whether you have solar, and it does the rest.
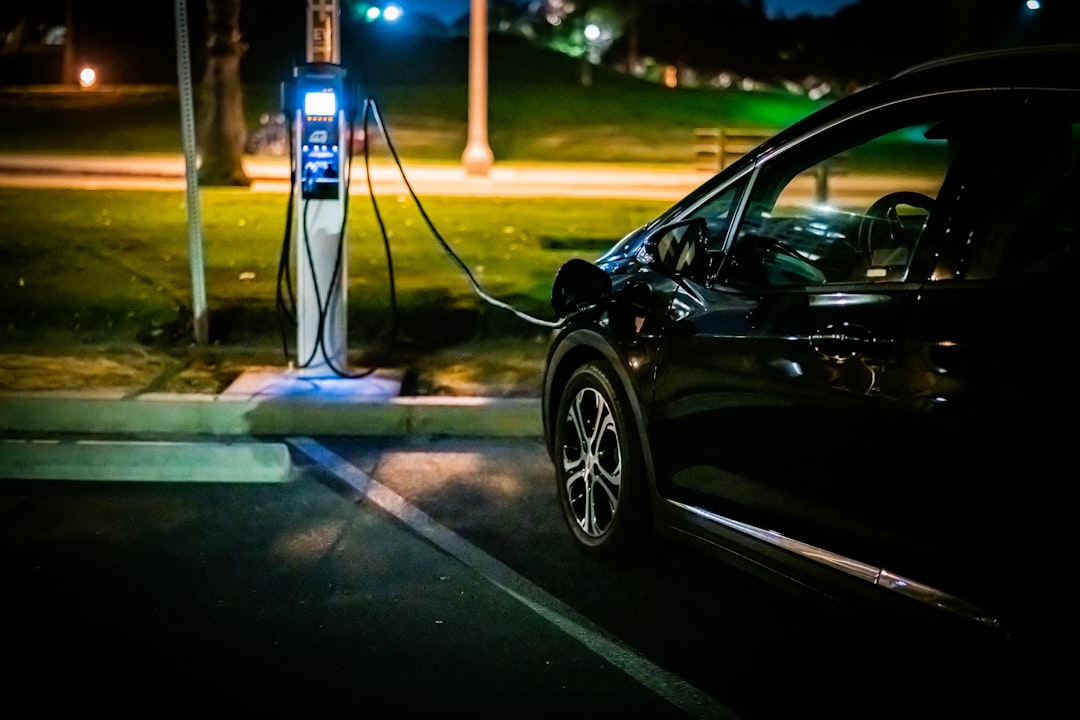
Public Charging Infrastructure: More Joburg, Same Price
GridCars operates over 350 AC and DC fast charging connectors across South Africa, many located in the more populated provinces of the Western Cape, KwaZulu-Natal, and Gauteng. The company’s chargers account for around 60% of SA’s total public charging points. That national footprint is not evenly distributed, and Johannesburg’s Gauteng concentration gives it a clear numerical advantage over the Western Cape.
In Johannesburg, you’ll find GridCars stations spread through Sandton, Rosebank, Fourways, Midrand, and Centurion. There’s a 200 kW DC charger at the Mall of Africa in Johannesburg, which cost approximately R2.5 million to install, while Canal Walk in Cape Town hosts a 150 kW DC charger costing around R1.5 million. The Joburg station is more powerful — but both cities now have serious fast-charging anchor sites.
In Cape Town, as of April 2026, Cape Town has limited DC fast charging infrastructure, with most public EV charging stations being 7 kW AC chargers requiring 3–6 hours for a meaningful charge. This is a genuine weakness for the Mother City. Cape Town has approximately 45–50 public charging locations, and relying on them exclusively costs 67% more than home charging, adding a R600–R1,300/month premium.
On pricing, the national tariffs are consistent regardless of city. As of August 2025, standard public EV charging tariffs are R7.00/kWh for Rubicon eMSP customers on DC charging stations, R7.35/kWh for GridCars eMSP customers on DC, and R5.88/kWh for both on AC charging stations. These rates apply nationally — so you pay the same per kWh at Canal Walk in Cape Town as you do at Mall of Africa in Johannesburg. The difference is simply availability and whether you can find a station nearby when you need one.
Home charging dominates EV usage — up to 80% of EV users rarely rely on public infrastructure — but public charging is essential to building long-distance travel confidence and wider EV adoption.
For apartment dwellers and anyone without a garage, Johannesburg wins on public charging. More stations, denser coverage in the business districts where people work, and the same national tariffs. Find public charging stations near you using our live EV charging map — it shows real-time availability across both cities.
How Much Could You Save With an EV?
Use our free calculator to compare your current fuel costs with EV charging costs.
Solar + EV: Where Cape Town Pulls Clear
Here’s the thing: if you own solar panels, the entire analysis flips. And in Cape Town, that matters more than anywhere else in South Africa.
Cape Town averages approximately 2,982 sunshine hours per year — roughly 8.2 hours of usable solar generation per day. Cape Town plans R39.7 billion in infrastructure over three years, a 63% higher spend than Johannesburg, with nearly one-third earmarked for electricity network upgrades — including substation capacity to integrate rooftop solar. The city’s infrastructure investment is explicitly designed to support solar prosumers (households that both produce and consume electricity). Johannesburg, by contrast, averages closer to 2,678 sunshine hours annually — still excellent by global standards, but roughly 300 fewer hours than Cape Town.
The practical impact for EV owners is significant. A Cape Town homeowner working from home can charge their car during peak solar production hours (10am–3pm) using surplus rooftop generation at effectively R0.00/kWh. With a 10 kW system and 10 kWh battery storage, a typical BYD Atto 3 owner doing 25,000 km/year can meet 60–80% of their charging needs from solar. At 80% solar coverage, annual charging costs drop from R7,796 to around R1,559 per year (the remaining 20% charged at off-peak grid rates — 20% of 4,125 kWh = 825 kWh × R1.89/kWh = R1,559). That’s R0.06/km — a figure that makes even the cheapest petrol car look expensive.
Cape Town’s unbundled tariff structure rewards customers who shift demand off-peak through time-of-use rates, and a clear separation of network fees eases future net-billing schemes (arrangements where prosumers receive market-linked prices for exported energy). That’s a policy environment purpose-built for the solar-plus-EV owner.
In Johannesburg, solar works too — but with 10% less annual yield and a slightly less prosumer-friendly tariff framework, the financial case is weaker. A Joburg solar owner doing the same 25,000 km/year might realistically cover 50% of charging from solar (versus Cape Town’s 60–80%), saving around R3,610/year versus R4,678 in Cape Town.
If you’re combining solar with an EV, Cape Town is definitively the better city. If you’re purely grid-reliant, Johannesburg has the edge.
Load-Shedding in 2026: Finally, a Non-Issue
This section would have been very different two years ago. In 2022–2023, load-shedding was the single biggest risk factor for EV ownership in both cities, and Johannesburg bore the brunt of it — Stage 3–6 shedding was routine, while Cape Town fared marginally better due to its own generation capacity.
In 2026, the picture has changed dramatically. South Africa reached 300 consecutive days without load-shedding at midnight on 12 March 2026, a significant milestone underscoring the continued recovery and strengthening of Eskom’s generation fleet under the Generation Recovery Plan. And it has continued from there. Eskom has entered the 2026 winter season with a resilient power system, projecting a winter period of continued energy stability from 1 April to 31 August 2026.
Where Eskom was only maintaining a consistent energy supply of 9% as little as two years ago, it has brought that number up to 98.9% over the last financial year (1 April 2025 – 31 March 2026). That’s not marketing spin — that’s a fundamental operational turnaround that changes the EV ownership calculus completely.
But here’s the important nuance: as Eskom shared the milestone of going more than 320 days without load-shedding, South Africans noted that those in townships and rural areas have continued to experience scheduled power outages through load reduction. Load reduction and load-shedding are different things. For EV owners in the suburbs of Cape Town or Johannesburg — the primary market for these vehicles — off-peak overnight charging is now reliable for the first time in five years.
For the financial year to date (1 April 2025 to 12 March 2026), diesel expenditure is R8.58 billion lower than during the same period last year, a 57.35% reduction year on year. That’s Eskom burning less emergency diesel because the grid is stable. For EV owners, this means you can set your wallbox timer to 11pm with confidence — in both cities. Verdict on load-shedding: tie. Both cities now equally reliable for overnight charging.
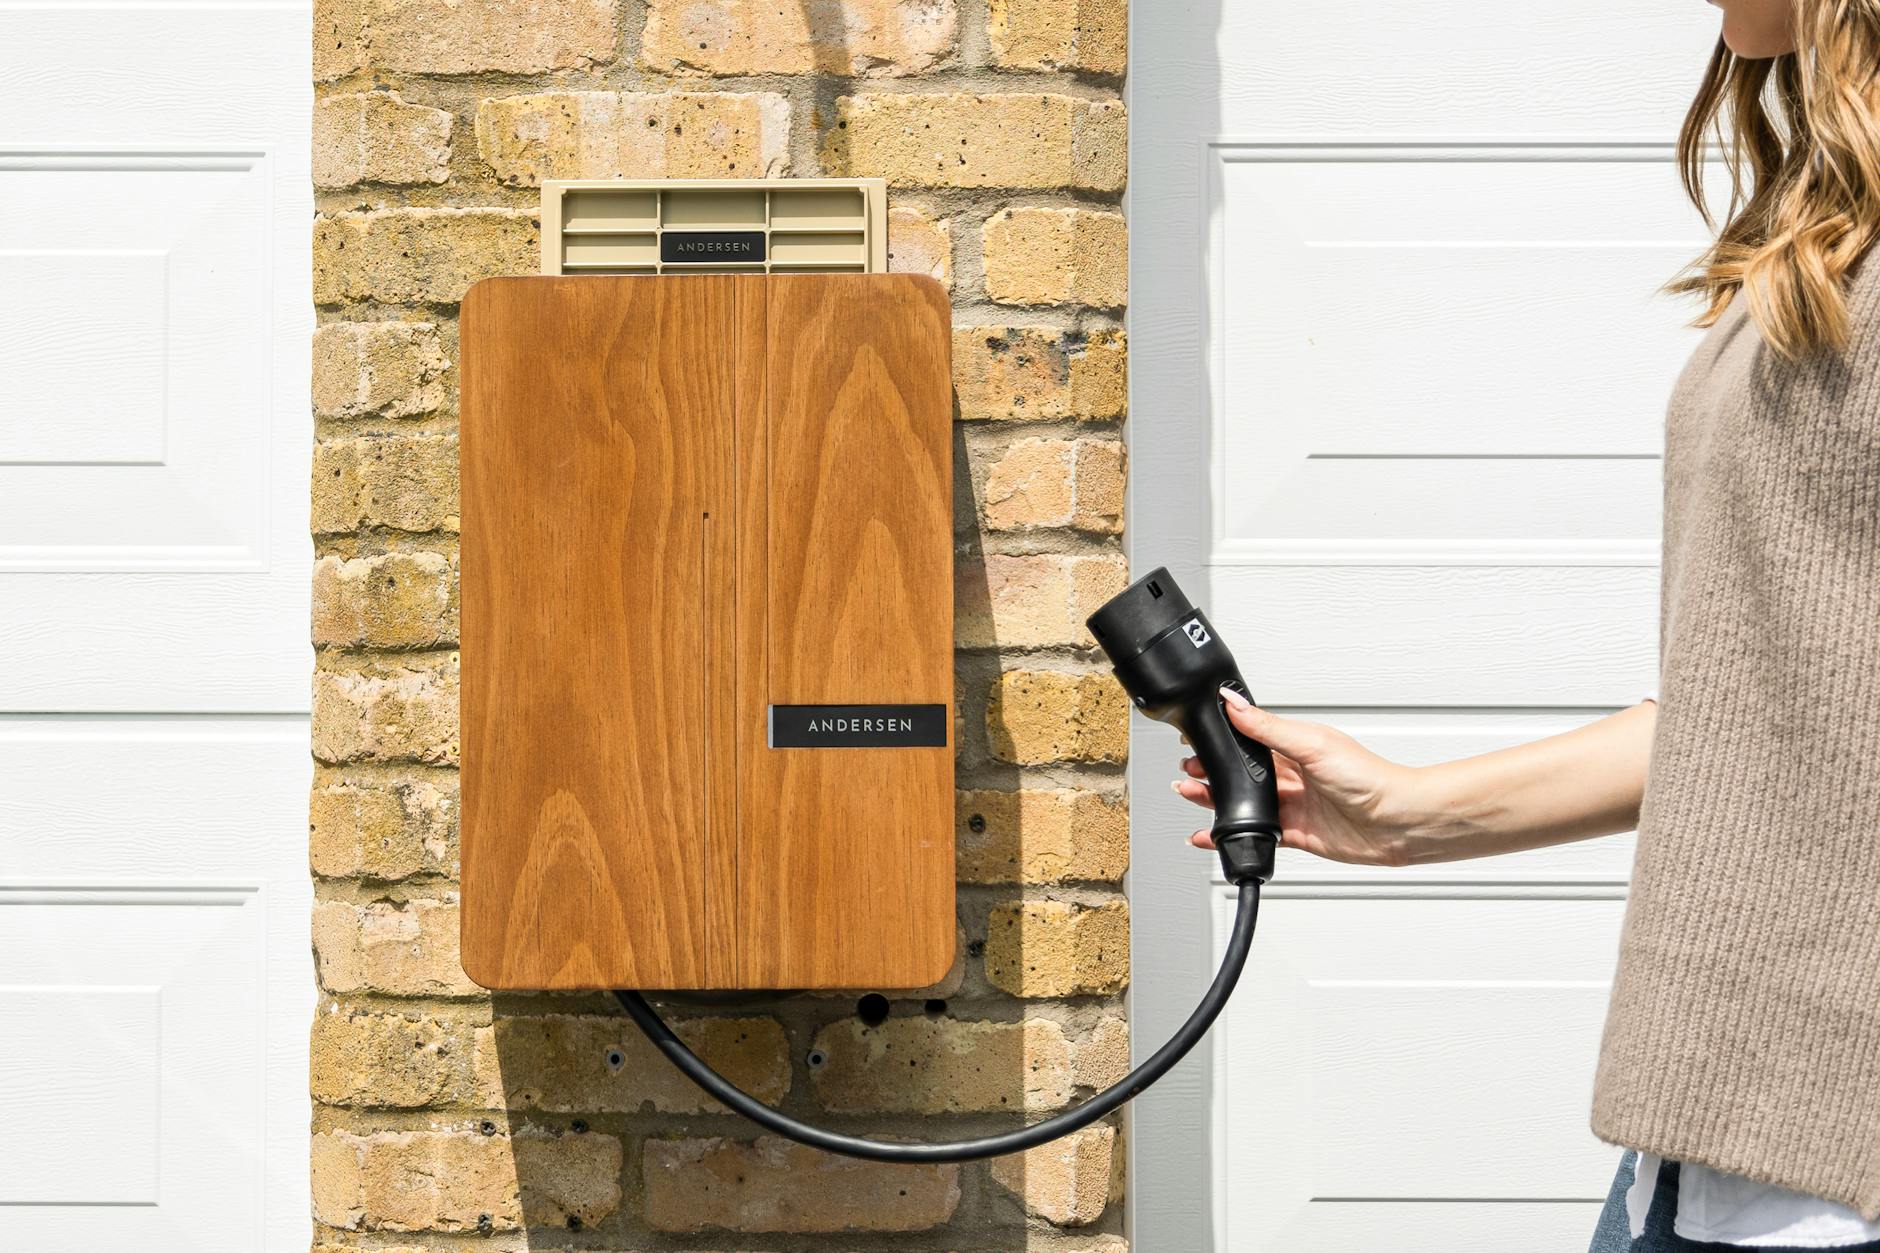
Thinking about a home charger to lock in those off-peak rates? Get a free home charger installation quote for Cape Town or Johannesburg — our team covers both metros.
Ready to Install a Home Charger?
Get a free, no-obligation quote for professional EV charger installation in South Africa.
Real-World Case Studies: Three SA Owners, Three Very Different Bills
Theory is useful. Real numbers are better. Here are three owner scenarios that illustrate how city, driving pattern, and solar access combine to produce wildly different annual charging bills.
Case Study 1: Sarah, Constantia, Cape Town — BYD Dolphin, 15,000 km/year
Sarah charges 100% off-peak with a 7 kW wallbox, timer set for 11pm. No solar (yet). The BYD Dolphin uses approximately 13.8 kWh/100 km, so she consumes 2,070 kWh/year for the car.
At CoCT’s off-peak rate of R1.89/kWh, that’s R3,912/year — or R0.26/km. Compare that to a VW Polo 1.0 TSI at 6.5 L/100 km with petrol at R24.50/L: R23,888/year in fuel alone, versus R3,912 in electricity. Sarah saves R19,976 per year just on energy. Over five years, that’s R99,880 in her pocket. Not a typo.
Case Study 2: David, Fourways, Johannesburg — Tesla Model Y, 30,000 km/year
David is a high-mileage driver. He charges 70% at home (off-peak) and uses public DC fast chargers for the remaining 30% — mostly on business trips to Pretoria and Durban. The Model Y uses approximately 16.2 kWh/100 km, consuming 4,860 kWh/year total.
Home charging (3,402 kWh at R1.75/kWh off-peak): R5,954. Public DC fast charging at R7.00/kWh for Rubicon eMSP customers on 1,458 kWh: R10,206. Total: R16,160/year, or R0.54/km. That’s still less than half the running cost of a BMW X3 30d doing 7.5 L/100 km at R26/L (R58,500/year in diesel). David saves R42,340 per year on fuel. Five-year saving: R211,700.
Case Study 3: John, Durbanville, Cape Town — BYD Atto 3, 25,000 km/year, Solar Owner
John has a 10 kW solar system with a 15 kWh battery. He works from home and charges his Atto 3 between 10am and 2pm using surplus solar generation. He tops up off the grid overnight when solar doesn’t cover his needs — roughly 20% of his total consumption.
Solar charging (3,300 kWh at R0.00): R0. Off-peak grid top-up (825 kWh at R1.89/kWh): R1,559. Total annual charging cost: R1,559 — or R0.06/km. He’s essentially driving for free. Compared to a Toyota Fortuner diesel at 8.5 L/100 km and R26/L (R55,250/year in diesel), John saves R53,691 per year. The Fortuner’s annual fuel bill would pay for John’s EV electricity for 35 years.
Which City Actually Wins? The Honest Verdict
The answer isn’t one-size-fits-all — it depends on your driver profile. Here’s the breakdown:
For off-peak home charging (the majority of EV owners): Johannesburg wins. The City Power off-peak rate is R0.14/kWh cheaper than CoCT, translating to R0.29/km vs R0.31/km. At 25,000 km/year, that’s R577/year in Joburg’s favour. At 30,000 km/year for a high-mileage driver, it’s closer to R700.
For solar plus EV owners: Cape Town wins decisively. With 300 more sunshine hours per year, higher residential solar adoption rates, and CoCT’s infrastructure investment in grid modernisation, Cape Town EV owners with solar can meet 60–80% of their charging needs at R0.00/kWh. In Johannesburg the solar advantage exists but is 10–15% less productive annually.
For apartment dwellers relying on public charging: Johannesburg wins. More stations, better coverage in business districts, and the same national tariffs. GridCars is South Africa’s largest EV charging network operator by number of charging stations, having been the first to enter the local EV charging market, founded in 2009. Its Gauteng concentration gives Joburg residents more options.
For low-mileage drivers (under 15,000 km/year): It’s a tie. The intercity difference amounts to R200–400/year — less than a tank of petrol. Not worth optimising for.
Add in property rates, water, refuse, and sanitation, and Cape Town’s total municipal bill remains R500–R800 below Johannesburg for homes under R3 million — meaning Cape Town is cheaper overall as a place to live and charge, even if Joburg’s electricity unit rate has a slight edge.
The uncomfortable truth is that even with the higher costs of public charging, EVs remain significantly cheaper to operate — typically one-third to one-half the cost of comparable petrol-powered vehicles, even when relying solely on public infrastructure. Both cities are so dramatically cheaper than petrol that the Cape Town vs Johannesburg argument is ultimately splitting hairs. The real winner is any South African city in 2026.

Find Charging Stations Near You
Explore our live map of EV charging stations across South Africa — updated in real time.
The Verdict: City Power Wins on Cents, Cape Town Wins on Sense
Johannesburg is the cheaper city for pure electricity cost — there’s no getting around it. If you’re a homeowner with off-peak charging and no solar, City Power saves you R577–R701 per year compared to CoCT. At 30,000+ km/year, that climbs toward R1,000. Over five years, that’s R3,500–R5,000 in Joburg’s favour on electricity alone.
But Cape Town makes more financial sense the moment you add solar to the equation — which more and more homeowners already have. CoCT’s tariff structure rewards customers who shift demand off-peak, and the clear separation of network fees eases net-billing schemes where prosumers receive market-linked prices for exported energy. That’s a city actively building infrastructure to support the solar-plus-EV lifestyle.
And then there’s this: the BYD Dolphin Surf starts at R339,900 for the Comfort trim, the grid is stable for the first time in five years, and South Africa introduced a 150% tax deduction for EV production in 2026. We are living through the best conditions in SA history to buy an EV. Which city you live in matters far less than whether you can charge at home — and whether you’re planning to add solar while you’re at it.
If you’re on the fence about installation costs for a home wallbox, the maths are compelling in both cities. See what you’d save by switching to an EV in your city — our calculator handles both CoCT and City Power tariffs. And when you’re ready to install, get a free wallbox installation quote — we work across both metros, and the process is simpler than most people think.
FAQ
Is Cape Town or Johannesburg better for EV ownership in 2026?
It depends on your setup. Johannesburg (City Power) has slightly cheaper electricity tariffs — roughly R0.29/km off-peak versus Cape Town’s R0.31/km — making it 7–9% cheaper for pure home charging. However, Cape Town wins decisively if you have solar panels, thanks to approximately 300 more sunshine hours per year and a tariff structure that rewards solar self-consumption. For overall municipal costs, Cape Town is cheaper on a like-for-like household basis. Both cities are dramatically cheaper to drive in than any petrol vehicle. For more on EV cost comparisons, see the U.S. Department of Energy’s home charging guide, which outlines similar principles applicable globally.
What is the cheapest way to charge an EV in South Africa?
Home charging on an off-peak tariff is the cheapest option by a wide margin. Home charging typically costs between R3.00 and R4.00/kWh in South Africa. Public AC charging averages around R5.88/kWh, while public DC fast charging ranges from R7.00 to R7.50/kWh. The cheapest possible scenario is home charging with surplus solar power at R0.00/kWh during daytime hours. Set your wallbox timer for off-peak hours (typically 10pm–6am in both cities) and you’ll pay the lowest grid rate automatically. The U.S. National Renewable Energy Laboratory provides detailed analysis on home charging economics that mirrors South African findings.
Can I charge my EV during load-shedding in 2026?
Eskom has entered the 2026 winter season projecting continued energy stability from 1 April to 31 August 2026. South Africa reached 300 consecutive days without load-shedding at midnight on 12 March 2026. In practical terms, overnight charging is now reliable in the suburbs of both Cape Town and Johannesburg for the first time in five years. If you have solar and battery backup, you can charge during the day from stored solar energy regardless of any future grid disruptions. Load reduction (distinct from load-shedding) still affects some township areas. For context on grid stability improvements, see the International Energy Agency’s report on electricity grid security.
How much does public charging cost vs home charging in South Africa?
Standard public EV charging tariffs as of August 2025 are R7.00/kWh for Rubicon eMSP customers on DC fast chargers, R7.35/kWh for GridCars eMSP customers on DC, and R5.88/kWh for AC charging at both networks. Compare that to off-peak home charging at R1.75–R1.89/kWh in Johannesburg and Cape Town respectively. Public DC fast charging costs roughly three to four times more per kWh than home off-peak charging. Use our live charging map to find public stations near you — but plan to do most of your charging at home.
Should I install solar before buying an EV, or buy the EV first?
Buy the EV first, charge it on off-peak grid power, and use the savings versus petrol to fund your solar deposit. Most EV owners save R15,000–R50,000 per year versus petrol running costs (depending on vehicle and mileage), which creates meaningful cashflow to service a solar finance agreement. In Cape Town specifically, the combination of strong solar irradiance and CoCT’s infrastructure investment makes solar-plus-EV the highest-return home energy upgrade available. In Johannesburg, the numbers are slightly weaker but still compelling. Calculate your potential savings before making the decision.
Continue Reading