
Key points
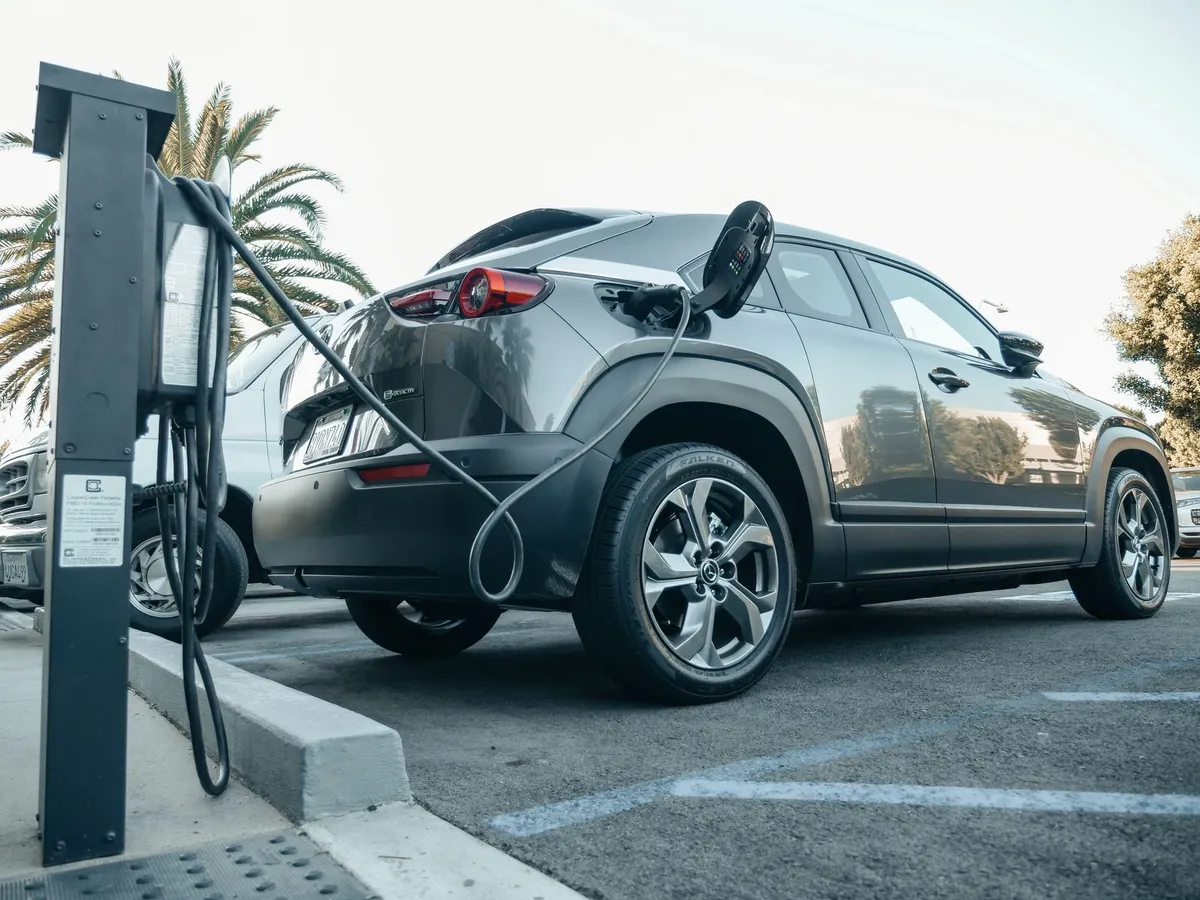
- Depot charging is not optional for fleets: Cartrack warns that public chargers create “massive downtime” and most remain grid-dependent, going offline during any load-shedding stage.
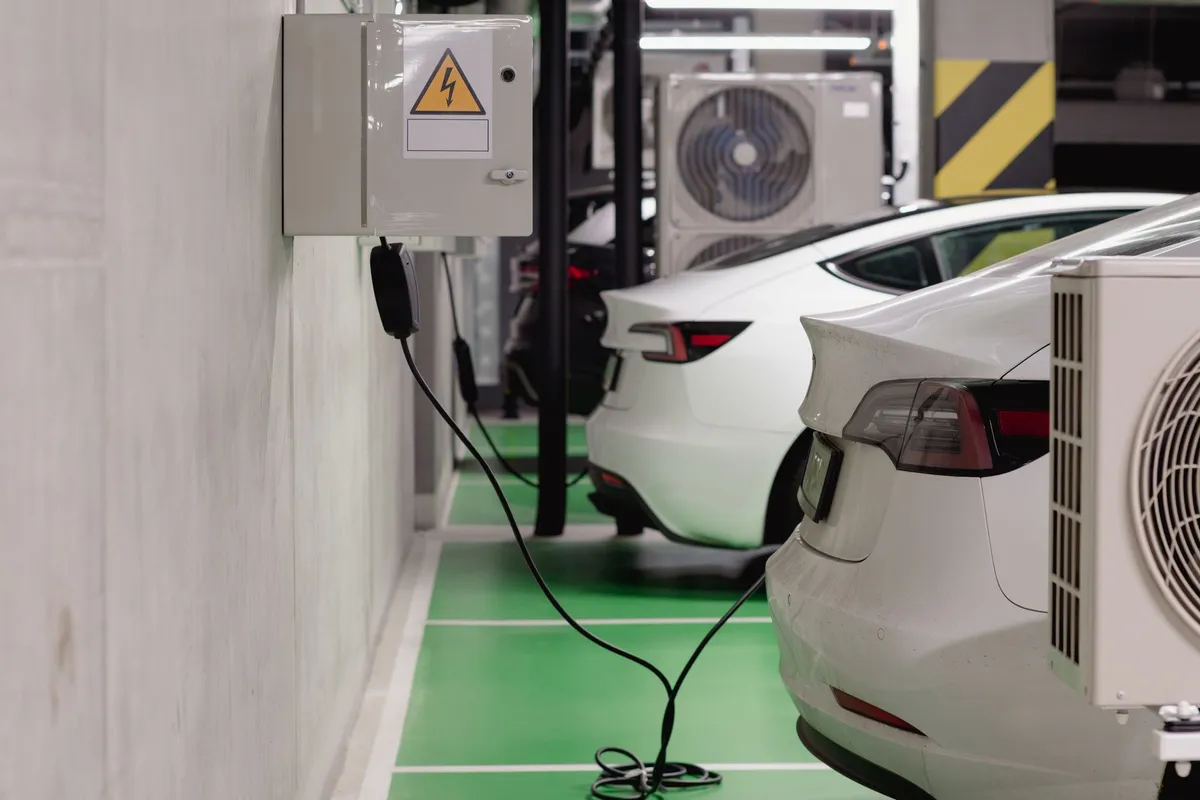
- Smart charging with Dynamic Load Balancing (DLB) is mandatory for multi-vehicle depots; without it, two simultaneous 7 kW chargers draw roughly 64A and risk tripping your main supply.
- Real operating data from Everlectric published by CleanTechnica (June 2026) shows electric fleet TCO is 15-27% lower than diesel equivalents, savings that accelerate as diesel prices rise.
- OCPP 1.6J is the minimum protocol for any commercial fleet charger. Without it, you lose remote visibility, billing attribution, and firmware control across your depot.
- All fixed EV charger installations in South Africa must comply with SANS 10142-1 (including 2024/2025 Annex N), use SANS 62196-2 or SANS 62196-3 connectors, and be accompanied by an electrical Certificate of Compliance (CoC) issued by an ECSA-registered installer.
- A correctly engineered 60 kW DC dual-gun depot site costs approximately R650,000 all-in. Incorrect installation can double that cost within 18 months (Aeversa).
- Eskom demand charges (R52.65/kVA/month in high-demand season under Megaflex FY26/27) bite whether or not anyone charges. Load management is not a nice-to-have; it is a direct line on your P&L.
- The 8.76% Eskom tariff increase from 1 April 2026, followed by a further 9.01% from 1 July 2026, makes the per-km electricity advantage over diesel widen every quarter you delay electrification.
Why fleet managers cannot rely on public charging infrastructure
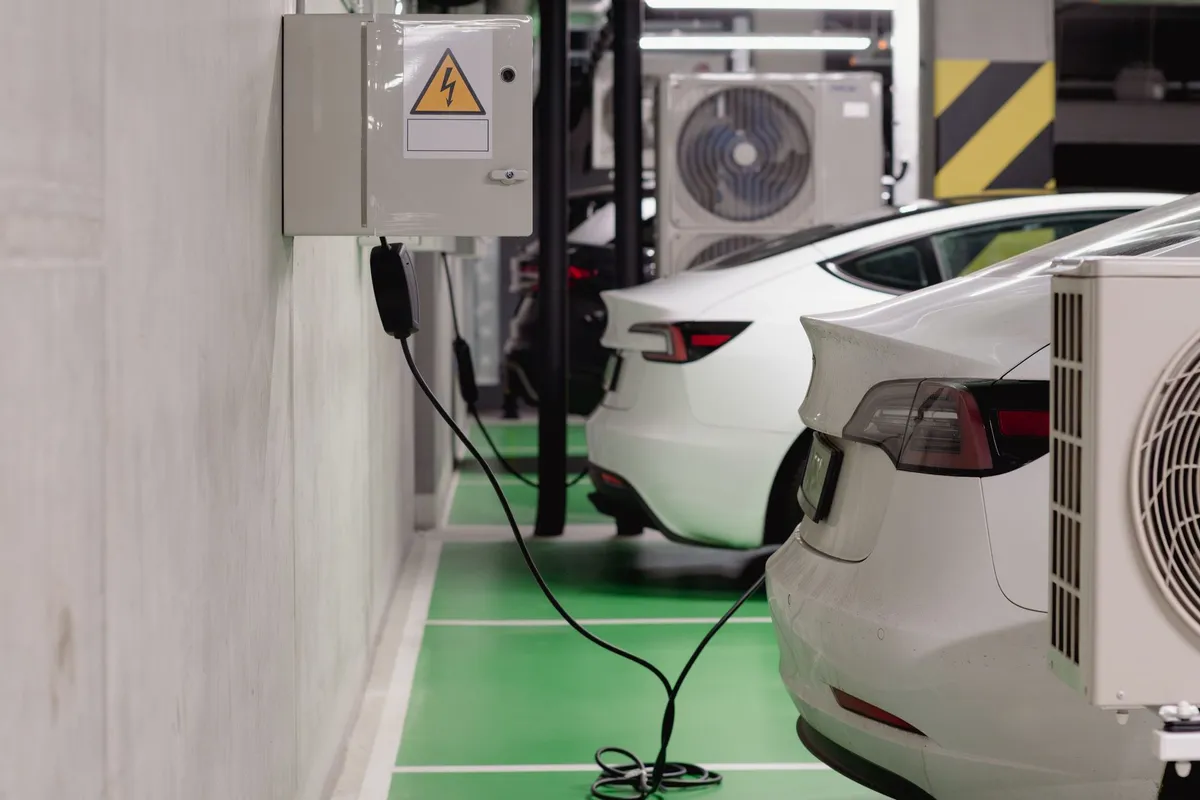
If you manage a fleet, the maths on public charging are straightforward and unflattering. The Charge Pocket app lists approximately 445 sites and 650 individual chargers across South Africa, compared to roughly 5,000 petrol stations, one charging site for every eleven fuel stations. Reliability is a separate problem: most public chargers remain grid-dependent and go offline during any load-shedding stage. A Stage 4 outage is not an inconvenience for a fleet driver depending on public infrastructure; it is a range emergency.
“It’s worth mentioning that GridCars is not right 100% of the time, the fast charger in Caledon on the N2, for example, doesn’t always work but shows that it’s online on the map. If you’re planning a mega road trip in your EV, it’s probably best to call GridCars beforehand to find out if the charger is working as it should.”
AutoTrader SA editorial, August 2024
Thinking about a home charger?Get a fixed-price installation quote — a few quick questions and we’ll send your cost, with no surprises on the day.Get my fixed-price quote →
That is a single charger on a leisure route. For a delivery fleet running fixed daily cycles, an unreliable public charger is not a minor inconvenience; it stops vehicles completing their routes. Cartrack, South Africa’s dominant fleet telematics provider, describes waiting at public chargers as creating “massive downtime” for fleet operators and recommends depot charging as the primary solution. This guide is about how to do that correctly.
The economic case: what the numbers actually say
For most South African fleet operators, fuel is the single largest variable operating cost. Golden Arrow Bus Services (GABS), the Cape Town commuter bus operator that took delivery of 120 BYD electric buses in 2025 and has accumulated over 3,300,000 km of operational data from its electric fleet, reports that fuel costs represent approximately 31% of total operating costs (Enterprise Africa). That is the number driving electrification decisions at scale.
“This should be reviewed as part of South Africa’s just energy transition framework. With over 3,300,000km of data available, the operation of the electric buses has been successful thus far. Fuel prices play a major role in Golden Arrow’s operational costs given that our fleet requires 25-million litres of diesel every year.”
Golden Arrow Bus Services, Business Day, March 2026
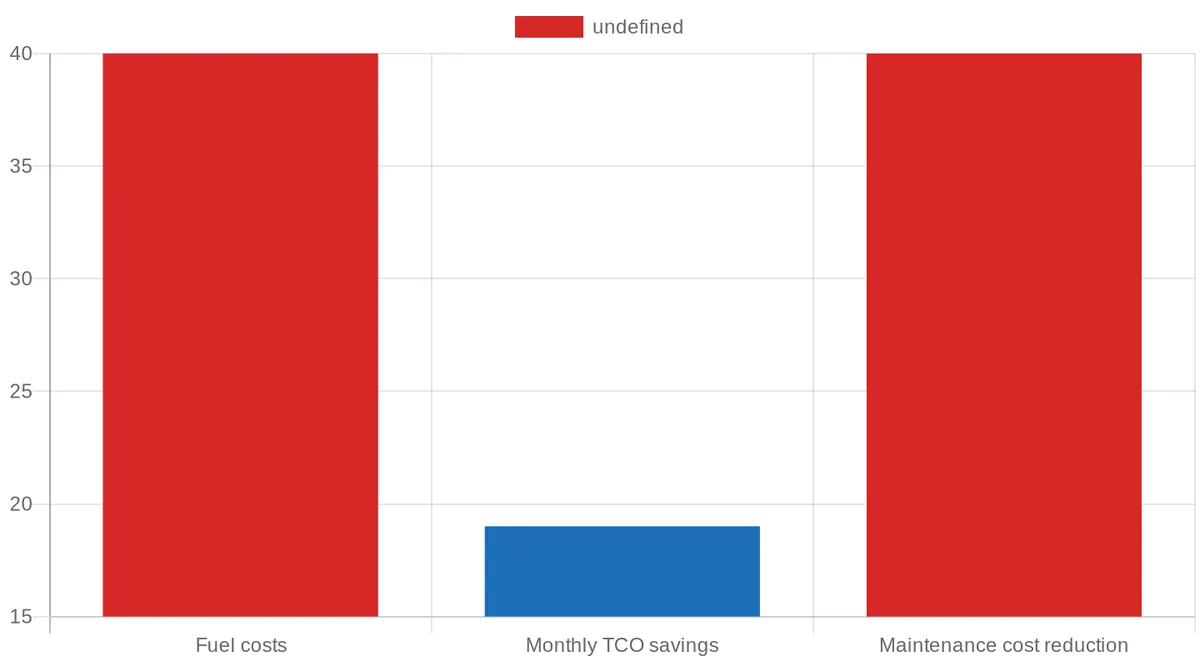
Real operating data from Everlectric, published by CleanTechnica in June 2026, shows electric fleet TCO is 15-27% lower than diesel equivalents, a cost advantage that sharpens as diesel approaches R32/L. The Takealot case study, using 11 JAC N75 EV trucks managed by Aeversa from October 2023, produced a verified 12.75% average monthly TCO reduction, a 39% reduction in energy consumption per km, and a 250% reduction in under-20% state-of-charge events (JAC Motors SA, July 2024). These are not projected figures; they come from 24 months of operational data.
“Takealot and many other fleet managers in South Africa constantly face rising fuel costs and fluctuating diesel prices, making budget planning increasingly challenging. Traditional internal combustion engine vehicles, with their lower energy efficiency and higher maintenance costs, exacerbate these issues.”
Reando Potgieter, COO of Aeversa, JAC Motors SA, July 2024
On a per-km energy basis, commercial EVs in South Africa run 40-60% cheaper than diesel vehicles on a fuel-cost basis (Aeversa). With Eskom tariffs increasing 8.76% from 1 April 2026 and a further 9.01% from 1 July 2026, and with diesel prices subject to monthly rand volatility, the electricity-versus-diesel gap is structurally widening in electricity’s favour every quarter.
Cost of ownership comparison: depot EV versus diesel fleet
| Cost line | Diesel fleet (per vehicle) | EV fleet with depot charging (per vehicle) | Notes |
|---|---|---|---|
| Fuel / energy cost per km | Benchmark 100% | 40-60% of diesel equivalent | Aeversa; varies by vehicle class and route |
| TCO vs diesel | Baseline | 15-27% lower | Everlectric real operating data, CleanTechnica June 2026 |
| Maintenance cost | Benchmark 100% | Up to 40% lower | Fewer moving parts, no oil changes; EV parts currently more expensive per component (Nedbank) |
| Vehicle capital cost (bus-class example) | ~R2.7 million per bus | R5.4m, R8.1m per bus (2-3x premium) | ITWeb / GreenCape 2024; gap narrows at scale and over lease term |
| Depot charger capital (60 kW DC dual-gun site) | Not applicable | ~R650,000 all-in (illustrative) | ChargePointSA illustrative model; verify per site |
| Demand charges (Eskom Megaflex FY26/27) | Not applicable | R52.65/kVA/month (high-demand season); R26.29/kVA/month (low-demand season) | Billed on peak kVA whether or not charging occurs; load management directly reduces this |
| Public DC charging (if used) | Not applicable | R7.00-R7.35/kWh (August 2025 rates) | Verify current tariffs before budgeting; rates subject to change |
| Smart charging payback range | Not applicable | ~1.2 years at ~350 kWh/day throughput (captive depot) | ChargePointSA illustrative; a 30 kWh/day site may never pay back on energy revenue alone without fleet fuel savings |
What GABS actually built: a peer-reviewed blueprint
The most thoroughly documented depot charging project in South Africa is the Golden Arrow Bus Services Arrow Gate depot in Cape Town. GABS expanded its electric bus fleet from 2 to 60 BYD B12 buses within the first 8 months of 2025 (MDPI / World Electric Vehicle Association, November 2025). Each bus carries a 230 kWh LFP battery rated at 100 kW DC charge input. The engineering decisions GABS made are directly applicable to any South African fleet depot.
The first decision was a deliberate charging cap: GABS imposed a 30 kW per bus charging limit to avoid the City of Cape Town’s high demand surcharges. At 30 kW, a full charge from 20% to 100% state of charge takes just over 6 hours, which GABS aligned with the off-peak tariff window of 22:00 to 04:00. The second decision was software-driven load management. A Mixed Integer Linear Programming (MILP)-optimised charging schedule reduced peak demand charges by 17% compared to an unmanaged baseline, keeping total depot demand below 1 MW (MDPI / WEVA, November 2025). The depot’s grid supply was tripled in four months by the integrating contractor, incorporating a 1.2 MWh battery system and on-site solar alongside the Autel DC120 chargers (Daily Maverick, September 2025).
“There have been no noteworthy issues so far, just one pleasant surprise: the Lion’s Explorer E uses less energy than we had expected. Diesel is significantly more expensive than electricity here.”
GABS operations executive, Enterprise Africa
GABS CEO Francois Meyer captured the institutional challenge plainly:
“It’s not easy to make such a big strategic change. We have data on 1,200 diesel buses. We know everything about them.”
Francois Meyer, CEO, Golden Arrow Bus Services, Engineering News, March 2025
If you manage a fleet and are considering electrification, that quote describes your situation precisely. The GABS blueprint answers it: start with a pilot, instrument everything, and let the data build your confidence before scaling.
Load management: the item most depot plans get wrong
Dynamic Load Balancing (DLB) is a system-level function that monitors total site power consumption in real time and distributes available electrical capacity across all active chargers. According to JointCharging’s fleet charging research, DLB is not optional for multi-vehicle depots; it is a direct operational requirement. The reason is simple arithmetic: two 7 kW chargers running simultaneously draw roughly 64A, which risks tripping the main site fuse if other loads are active (Rightcharge). In a depot with 10 or 20 vehicles, unmanaged charging creates demand spikes that translate directly into Eskom Megaflex demand charges billed at R52.65/kVA/month during high-demand season (Eskom FY26/27 tariff schedule). That charge applies whether or not anyone is actually charging.
The GABS MILP study demonstrated a 17% reduction in peak demand charges from software-managed scheduling alone. Fleet operators using smart charging management more broadly report up to 40% reduction in electricity costs versus unmanaged charging (JointCharging). The software is not an add-on; it is where a large portion of your operational saving is generated.
“Ampcontrol’s software solutions provide the energy management tools that Aeversa use to give local fleet owners the confidence that a large-scale EV fleet transition is possible, despite the country’s constrained electrical grid. The V2G and programmable charging schedules allow vehicle fleets to play a large role in helping South Africa’s power grid to stabilise.”
Reando Potgieter, Co-founder and COO of Aeversa, Ampcontrol press release, October 2022
Aeversa monitors power outages via Ampcontrol AmpEdge software, with battery energy storage systems set to auto-extend charging sessions when grid supply is interrupted, and demand response scheduled via API to react to predicted outages. This is the architecture that produced 99% charger uptime targets across their commercial fleet deployments (Ampcontrol Case Study).
Get your free commercial charging site plan, ChargePointSA will model the load management architecture and demand charge exposure for your specific depot before any hardware is ordered.
OCPP: why it is non-negotiable for commercial depots
Every commercial depot charger you specify must support OCPP (Open Charge Point Protocol). OCPP 1.6J is the minimum acceptable version; OCPP 2.0.1 is preferred for new deployments. Without OCPP, a charger operates as isolated hardware: no remote visibility, no charging session control, no billing data, and no firmware updates over the air. Every kilowatt-hour becomes unattributable to a specific vehicle or driver (Uland Power).
OCPP matters operationally because fleet managers need remote visibility, alert notifications, firmware control, diagnostics, transaction reporting, and support tools across potentially dozens of chargers. Manual management beyond a handful of units is not realistic (GoCharge.tech). Industry survey data shows that drivers and fleet operators who juggle five or more charging apps report negative attitudes outweighing positive ones by a ratio of 5 to 1 (FleetPoint); a single OCPP-connected backend eliminates this.
The practical caution is that OCPP is not always as simple to activate as the spec sheet implies. On the Victron EV Charging Station, for example, Victron community users reported in September 2025 that the OCPP tab did not appear despite firmware version v2.04 claiming availability, and OCPP 2.x support remains planned but without a confirmed delivery date (Victron Energy Community Forum). For home and small commercial use the Victron unit is a strong product; for enterprise fleet deployments requiring guaranteed OCPP compliance from day one, this is a point to verify explicitly with your installer before hardware is ordered.
“Been reading through OCPP on the EV Charger. Everything I’ve found, including Victron AI Support, says this is available on V2.04. However I don’t see the OCPP Tab appear. Anyone have any tricks?”
Victron Energy Community Forum user, September 2025
For small depot bays or overnight light commercial fleet charging where a compliance-verified, tethered, OCPP-ready unit is needed at 7 kW single-phase, the ChargePoint SA Caro Plus (CP-AC7) — from ~R8,900 per unit (indicative) + install quoted per site — supports OCPP 1.6/2.0.1, Wi-Fi/Bluetooth, dynamic load balancing and PV solar charging, and is IP65 weatherproof with a Type A + 6 mA DC earth-leakage device built in, giving you a known, fully documented specification from day one. For larger depot deployments requiring 22 kW AC, the ChargePoint SA Caro Pro (CP-AC22) — from ~R13,900 per unit (indicative) + install quoted per site — delivers 22 kW three-phase with dynamic load balancing, Wi-Fi/Ethernet/4G/BT, OCPP, and PV solar charging (IP65 · IK10). For DC fast charging at depot scale, your site assessment will determine the correct hardware from the ChargePoint SA DC range.
Understand OCPP, load balancing & fleet charging standards
Compliance: what the law requires and what installers miss
South African law under SANS 10142-1 requires all fixed EV charger installations to be performed by a licensed electrician. An unqualified installation can void insurance, create fire hazards, and expose the property owner or business to legal liability. The 2024/2025 update to SANS 10142-1 added Annex N, which specifically covers EV charging infrastructure requirements, and most generalist electricians are not aware of it.
The specific technical requirement most often missed is the RCD type. SANS 10142-1 mandates a dedicated 30 mA Type-B Residual Current Device for EV charging circuits, because DC leakage current from EV chargers can blind a standard Type-A RCD, rendering it non-functional as a safety device. Getting this wrong does not produce an obvious fault on the day of installation; it produces an invisible safety gap that remains until a fault occurs.
For connector standards: AC charging connectors in South Africa must comply with SANS 62196-2 (the Type 2 standard), and DC connectors must comply with SANS 62196-3 (CCS2 / CHAdeMO). Every installation requires an electrical Certificate of Compliance (CoC), which typically costs R800 to R1,500 and should be included in your installer’s quote. The CoC is the document that keeps your property insurance valid, enables a legal property transfer, and confirms the wiring meets the national standard.
All installations through ChargePointSA’s commercial programme are performed by ECSA-registered installers and include a full SANS 10142-1-compliant CoC as standard. This is not a differentiator we invented; it is the legal minimum, and it is the trust signal that most competitor quotes omit entirely.
“SANS 10142-1 compliance isn’t optional. An unregistered ‘electrician’ might charge R8,000 for an install, but without a valid CoC, your home insurance is void if the charger causes a fire. Always verify the electrician is registered with the Department of Employment and Labour.”
ChargePoint SA, EV Charger Installation Polokwane 2026 Cost Guide
For fleet depots, the stakes are higher than for a residential install. A non-compliant commercial installation exposes the business to liability across every vehicle and driver using the facility. Poor installation can also damage the charger hardware itself, which manufacturer warranties explicitly exclude.
What a depot charging system actually costs
The cost components of a commercial depot charging project fall into four categories: hardware, civil and electrical installation, ongoing demand charges, and operations and maintenance. The following figures are based on verified South African market data and should be validated against your specific site conditions in a formal engineering assessment.
Hardware: Aeversa cites commercial charger hardware at approximately R185,000 per unit for heavy commercial deployments. A dual-gun 60 kW DC site runs approximately R650,000 all-in on an illustrative basis (ChargePointSA model). For AC depot bays using 22 kW three-phase chargers, hardware costs are lower but installation cable runs and DB board upgrades can be significant depending on the distance from the main supply. A standard three-phase 11 to 22 kW installation in the residential and light commercial segment runs R19,000 to R40,000 including CoC; commercial depot pricing is site-specific and must be scoped formally.
Installation risk: Aeversa states explicitly that incorrect installation doubles cost within 18 months. A common specification error is ordering a 22 kW three-phase charger for a single-phase supply; the actual output is 7.4 kW and the overspend on hardware alone is R8,000 or more. For a 20-bay depot, this kind of error scales accordingly.
Ongoing demand charges: Under Eskom Megaflex FY26/27, demand is billed at R52.65/kVA/month in the high-demand season and R26.29/kVA/month in the low-demand season, on the peak kVA recorded during the billing period. An illustrative single 60 kW DC dual-gun site carries approximately R3,300 per month in demand charges plus approximately R3,500 per month in operations, maintenance, and software (ChargePointSA illustrative model). These are recurring costs that exist regardless of charging volume.
Payback: At approximately 30 kWh per day throughput, a DC site may never pay back on energy revenue alone without capturing the fleet fuel savings alongside it. At approximately 350 kWh per day (captive fleet depot utilisation), the same site reaches payback in roughly 1.2 years with an approximately 80% IRR (ChargePointSA illustrative model). These figures illustrate why sizing and utilisation planning must precede hardware procurement, not follow it.
“The whole goal of WattSpot is to stabilise the most unpredictable variable in fleet operations: whether a vehicle can charge when it needs to. 18,884 sessions across 3 sites gave us the route data to know exactly where the next chargers need to go. We are not guessing at expansion. The data builds the roadmap.”
Reando Potgieter, COO of Aeversa, Engineering News, May 2026
WattSpot: what South Africa’s first dedicated fleet network proved
Between December 2025 and February 2026, three WattSpot Gauteng sites dispensed 205,845 kWh across 18,884 charging sessions, with fleet vehicles covering over 2 million kilometres (Engineering News, May 2026). The sites run 60 kW DC fast chargers; current fleet vehicles draw a maximum of 20 kW per session. Network uptime was maintained above 98.5% from launch. Two additional sites were in installation phase at the time of reporting, with WattSpot (a joint venture between Aeversa and Valternative Energy) targeting 200 or more charge points across South Africa by 2027.
The operational model is instructive: fleet drivers book a charging slot through a dedicated app, the app handles payment at point of charge, charger faults escalate to the Aeversa technical team via WhatsApp, and Aeversa monitors in real time with technician or hardware replacement dispatched as required. This is the SLA architecture that produces 98.5% uptime in a country where grid reliability and OCPP communication faults are the dominant operational risks.
“Switching to an electric vehicle has changed everything for me. I no longer worry about petrol prices going up every week, and my running costs are actually lower. I’m able to take home more money consistently, and the experience of driving an electric car is smoother and I service it less.”
Uber Go Electric driver on the Valternative Energy EV4 programme, charging at WattSpot network sites in Gauteng, Engineering News, April 2026
For a fleet manager or logistics operator considering a depot project, the WattSpot data provides the nearest thing to a South African benchmark that currently exists: 60 kW DC hardware, managed via OCPP, with a monitored SLA, producing verified throughput and uptime figures across a constrained grid environment.
Energy security and load-shedding: the honest assessment
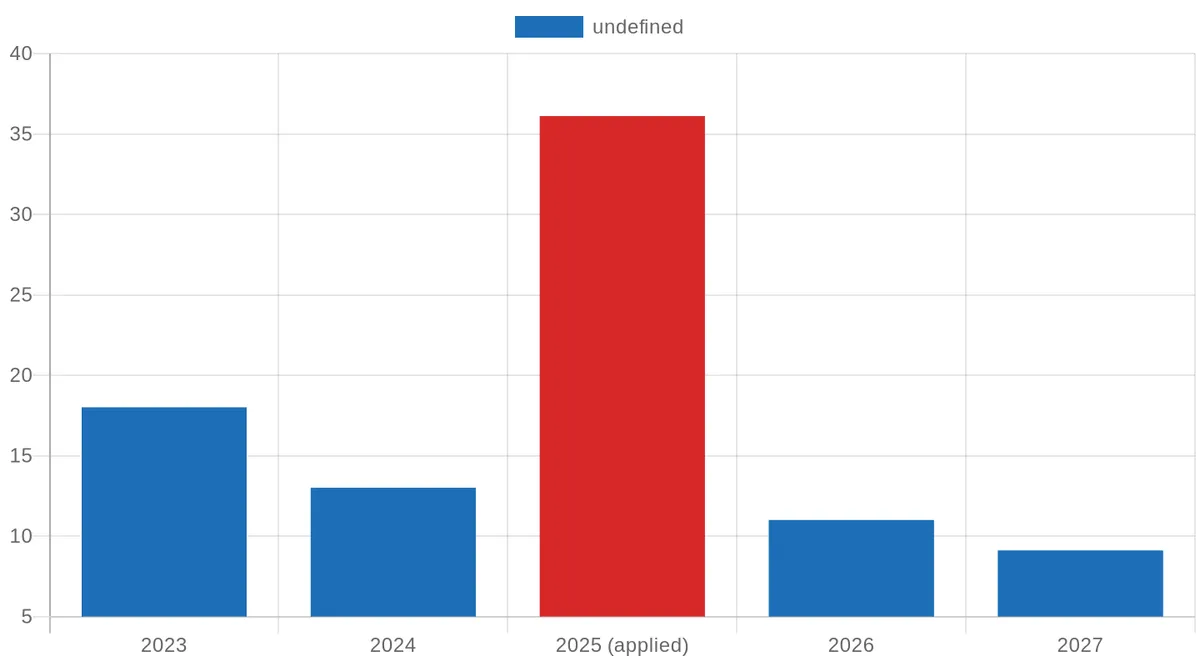
Load-shedding was suspended for 219 consecutive days from 26 March 2024 (Eskom, 1 November 2024), improving the operating environment considerably for EV fleet operators. However, GreenCape’s market intelligence position, published via ITWeb in May 2024, remains the most accurate description of the structural risk:
“Increased levels of load-shedding in 2023 have increased energy security concerns around the electrification of public transportation fleets in SA. There is a lack of charging infrastructure and renewable electricity to meet the demand of an electric bus and minibus taxi fleet in SA.”
GreenCape market intelligence, ITWeb, May 2024
A fleet of 1,000 electric buses would require 80 to 100 MW of renewable energy for charging (ITWeb / GreenCape). Fleet operators outside the Western Cape and Gauteng, where public charging infrastructure is most concentrated, face a genuine infrastructure gap when relying on any network beyond their own depot. The engineering response to this risk is on-site energy storage and solar integration. The GABS Arrow Gate depot incorporated a 1.2 MWh battery system and on-site solar. CHARGE (formerly Zero Carbon Charge) operates South Africa’s first off-grid solar-and-battery charging network on the N3 corridor at rates not subject to Eskom tariff hikes or load-shedding. 42% of GridCars chargers already use solar power integration. Battery storage is moving from a premium option to a standard component of a resilient depot design.
“Being totally self-sufficient in power, with on-site energy production, our rates are predictable and controlled and not subject to Eskom tariff hikes or load-shedding.”
CHARGE (Zero Carbon Charge), official website
Choosing the right ownership model for your depot
If you manage a fleet, the ownership structure of your charging infrastructure matters as much as the hardware specification. ChargePointSA’s commercial programme offers four models, matched to your organisation’s risk appetite and capital position:
- Host buys: You procure the hardware and installation outright. Full asset control, no ongoing fee to a third party, maximum long-term ROI. Requires upfront capex and internal responsibility for maintenance and compliance.
- Revenue-share: The charging operator co-invests; you share revenue from sessions. Reduces your upfront exposure while capturing some of the income from fleet or visitor charging.
- Investor-funded: A third-party investor funds the full installation. You host the chargers and receive a service. Suitable where capex is constrained or where board approval for infrastructure spend is complex.
- CPSA-owns-host-free: ChargePointSA owns and operates the infrastructure at your site. You host for free and gain the amenity without capital commitment. Suited to high-traffic commercial sites where the operator can recover costs through session revenue.
Aeversa’s Charging-as-a-Service model converts capex to a predictable monthly fee. Their verified client data shows a 12.75% TCO reduction (Takealot, JAC Motors SA 2024) and a separate case study showing cost savings of up to 17% on TCO over six months (Aeversa.com). The cost per charger decreases significantly as fleet scale increases, which is why sizing with the end goal in mind from day one matters more than minimising the initial deployment cost.
“We have been extremely satisfied with Aeversa’s Service Level Agreement for charger maintenance, on-site training, and monthly reporting. Their attention to detail in maintaining our chargers, comprehensive training programs for our staff, and detailed monthly reports have been instrumental in optimizing our EV vehicles.”
Commercial fleet operator client testimonial, Aeversa.com
ChargePointSA Commercial Programme: what we deliver
For any fleet manager or depot operator reading this guide, ChargePointSA’s commercial EV charging programme provides a single accountable contract covering charger supply, certified installation, and full compliance documentation, with one point of contact throughout. Every installation is performed by ECSA-registered installers, complies with SANS 10142-1 (including 2024/2025 Annex N), and is accompanied by an electrical CoC. Our national certified-installer network operates with standardised site surveys and fixed-scope pricing, not vague “from R…” estimates that expand after sign-off.
For commercial depot deployments, the specification is determined by your site assessment: vehicle dwell time, required throughput, grid connection capacity, load management software requirements, and your OCPP backend. That is what the site plan produces before any hardware is ordered.
The commercial EV charging landscape in South Africa does not yet have a harmonised standard across networks. Fragmented protocols and early-mover infrastructure create operational uncertainty (Anari Energy). Choosing an installer who specifies SANS 62196-2 and SANS 62196-3 compliant connectors, OCPP-verified hardware, and a CoC-backed installation removes that uncertainty from your side of the contract.
Frequently asked questions
How long does it take to install a depot charging system for a South African fleet?
The timeline depends on site complexity, grid connection capacity, and whether a new supply or switchgear upgrade is required. The GABS Arrow Gate depot tripled its grid supply and integrated a 1.2 MWh battery system in four months (Daily Maverick, September 2025), which is a large-scale example. A smaller depot installation with an existing adequate supply and a straightforward cable run can be commissioned in two to six weeks. The step that most operators underestimate is the utility application for increased supply: Eskom or a municipality can take eight to sixteen weeks to approve and implement a new connection or capacity upgrade. An engineered site assessment identifies this constraint before it delays your programme.
What is the minimum OCPP version I should specify for a fleet depot charger?
OCPP 1.6J is the minimum acceptable version for any commercial fleet charger in 2026. It provides the communication layer for authentication, remote start/stop, transaction reporting, firmware updates, and basic load management. OCPP 2.0.1 is preferred for new deployments because it adds enhanced security (mTLS), improved device management, and ISO 15118 Plug-and-Charge support. Be aware that OCPP 2.0.1 carries higher firmware complexity, and not all chargers that claim 2.0.1 compliance have completed full certification; verify this with your hardware supplier and request documentation. Without OCPP at minimum 1.6J, your charger is isolated hardware with no remote visibility, no billing attribution, and no fleet management integration.
Do I need a separate electrical Certificate of Compliance for each charger in a depot?
Under SANS 10142-1, a Certificate of Compliance is required for each distinct electrical installation. In a depot context, how many CoCs are required depends on how the installation is scoped: a single DB board serving multiple charger bays may be covered under one CoC for the wiring and distribution, with each charger circuit documented. Your ECSA-registered installer will scope this correctly and include the CoC cost in the project quote. A typical CoC costs R800 to R1,500. The CoC is the document that validates your installation against SANS 10142-1 (including Annex N), confirms the mandatory Type-B RCD is correctly specified, and is the evidence your insurer requires in the event of a claim.
Can I claim fleet EV charging costs against tax in South Africa?
SARS treats EV charging infrastructure installed for business purposes as a capital asset, eligible for depreciation under Section 11(e) or the accelerated allowance provisions applicable to machinery and plant. Section 12B of the Income Tax Act provides an accelerated depreciation allowance for renewable energy assets, which may apply if your depot includes solar or storage components. The applicable allowance depends on how the asset is classified and your tax year. We recommend confirming the treatment with your tax adviser before finalising the business case, as SARS guidance on EV-specific assets continues to develop.
What happens to my depot charging during load-shedding?
Without on-site energy storage, grid-connected depot chargers go offline during any load-shedding stage, precisely as public chargers do. For fleet operations with fixed overnight charging windows (such as the GABS 22:00 to 04:00 off-peak window), a load-shedding event during that window can result in vehicles dispatching undercharged the following morning. The engineering solutions are battery energy storage (as used at the GABS Arrow Gate depot with its 1.2 MWh system), solar with storage, or scheduling software that detects predicted outages via API and accelerates charging in the preceding window. Aeversa uses Ampcontrol AmpEdge for exactly this purpose. If your depot operates in an area with residual load-shedding risk, your site plan should include a storage or resilience component; a site assessment will model the cost against the operational risk.
How does Eskom’s Megaflex demand charge affect depot charging economics?
Eskom’s Megaflex tariff (applicable to large commercial and industrial connections) bills a network demand charge based on the highest kVA recorded during the billing period, not on total energy consumed. Under the FY26/27 schedule, this is R52.65/kVA/month during the high-demand season and R26.29/kVA/month during the low-demand season, on the peak kVA recorded during the billing period. If your depot peaks at 500 kVA during a single charging event, you are billed for that 500 kVA for the entire month, whether or not you ever reach that level again. Dynamic Load Balancing and MILP-optimised scheduling, as demonstrated at the GABS depot with a verified 17% reduction in peak demand charges (MDPI / WEVA, November 2025), directly reduce this cost. The demand charge calculation is why a smart charging software licence is never optional for a depot above a handful of vehicles.
What fleet managers wish they had known before they started
The GABS programme, now with over 3,300,000 km of operational data from its electric fleet, confirms that the post-installation experience is generally more positive than pre-project modelling suggests. Energy consumption came in lower than expected. Operational disruptions from the buses themselves were minimal. The complexity was in the infrastructure: grid upgrades, demand charge management, and the institutional challenge of rebuilding maintenance workflows and driver training from scratch for a technology where, as the CEO said, “we have data on 1,200 diesel buses” and none on electric ones.
“The golden thread behind the successes of international electric bus operations was partnerships with business, government and civil society.”
Gideon Neethling, Company Engineer, Golden Arrow Bus Services, IOL, March 2025
For any South African fleet manager, that observation is the most practical piece of advice in this guide. A fleet EV charging depot is not a procurement decision; it is an infrastructure project with grid, compliance, software, maintenance, and training dimensions running in parallel. The operators who succeed are the ones who engage a single accountable partner with the engineering capability to manage all of those dimensions under one contract, and who begin with a formal site assessment rather than a hardware catalogue.
If you manage a fleet and want to know what a depot charging system should cost, what charger specification suits your vehicle mix, and what the realistic payback looks like for your site: get your free commercial charging site plan from ChargePointSA. You will receive a recommended charger specification, a fixed-scope cost, a payback model, and a confirmed engineering site assessment, at no charge and with no obligation.
Photo: Jakub Zerdzicki / Pexels
Plan your fleet depot charging with ROI clarity
The Commercial Site Builder accounts for load management, compliance, and payback period — free, no obligation.
Plan my depot charging →WhatsApp us
CoC-certified installers, nationwide