
Key points
- A grid-connected DC fast-charger site costs R500,000 to R2,000,000+ all-in; Rubicon’s 200 kW Mall of Africa site ran to R2.5 million and its 150 kW Canal Walk site to R1.5 million (Greg Blandford, Enlit Africa 2025).
- Rubicon calculates that the Canal Walk site requires 8 to 10 sessions per day for three straight years to recover that R1.5 million. The entire South African public network averages roughly 1.5 to 2.5 sessions per charger per day (GridCars/TechCentral, January 2025).
- South Africa had only 3,543 cumulative passenger EVs on the road at the end of 2024. GridCars’ Winstone Jordaan says the sector needs roughly 100,000 EVs before public DC charging reaches real profitability.
- Eskom’s Miniflex demand charge applies to any connection above 100 kVA. For the 2026/27 financial year, Megaflex network demand charges run to R52.65/kVA/month in the high-demand season, billed whether anyone charges or not. Tariffs rose a further 8.76% from 1 April 2026 and 9.01% from 1 July 2026.
- Smart chargers with Dynamic Load Management (DLM) and battery storage can dramatically reduce NMD requirements and protect against NMD exceedance penalties.
- Off-grid solar-plus-storage is now a proven alternative: South Africa’s first fully off-grid DC fast-charging station opened near Wolmaransstad in November 2024, avoiding Eskom connection costs and tariff inflation entirely.
- 42% of GridCars’ chargers already use solar; a UNISA study found solar-paired Level 2 chargers achieved a 4.2-year payback versus 6.8 years for grid-only.
- All public DC connectors must comply with SANS 62196-3; installations require SANS 10142-1 wiring compliance, an electrical Certificate of Compliance (CoC), and ECSA-registered installers.
The honest starting point: where the numbers actually sit
If you run a filling station, a highway service plaza, or a large retail forecourt, you have almost certainly been pitched a DC fast charger in the last 12 months. The pitch usually leads with speed, “200 km of range in 20 minutes”, and glosses over two things that will determine whether your investment pays back: grid cost and utilisation.
South Africa had just 3,543 cumulative passenger battery-electric vehicles on the road at the end of 2024, according to the GreenCape Electric Vehicles Market Intelligence Report 2025. The public network had grown to over 500 charging stations and approximately 650 individual chargers by mid-2025 (ChargePoint SA, citing Rubicon annual report 2025 and GridCars). That gives a ratio of roughly one EV for every seven individual charge points, better than the global benchmark of 1:10, but that ratio is misleading when up to 90% of all EV charging in South Africa happens at home, not on a public forecourt (ESI Africa, quoting Enlit Africa 2025 panel).
The most candid assessment of this situation came from the two largest operators in the country at the Enlit Africa 2025 panel “The Business Case for EV Charging Infrastructure in Africa” in Cape Town.
“There’s just no business case. We need about 100,000 vehicles on the road before any of us will see real profitability. But that doesn’t mean we shouldn’t build the foundation now.”
That is not a counsel of despair. It is a map. If you understand precisely why the numbers look the way they do today, you can structure an investment that positions your forecourt for the utilisation growth that is coming, without destroying your balance sheet in the meantime.
What a DC fast-charger site actually costs in South Africa
Hardware alone is only part of the story. A 47 kW entry-level DC charger starts at roughly R400,000 in hardware cost (DriveElectric SA / iMotonews). Installation labour for a fast-charging unit starts at around R100,000 per unit in Gauteng (Handyman Johannesburg, 2025). But once you add a new or upgraded grid connection, civil works, switchgear, cabling, and network software, the total site cost climbs fast.
“Where the public charging infrastructure is concerned, the investment is quite high. So typically you start anywhere from a half million rand up to two million rand per site. I’ll give you two case examples. So we’ve got a 200 kilowatt DC charger at the Mall of Africa in Johannesburg. That site cost us… about R2.5 million. We’ve got a site at Canal Walk [shopping centre] in Cape Town, which is 150 kilowatt DC, that’s about R1.5 million.”
The ChargePoint SA CP-DC60, a 60 to 120 kW dual-outlet DC fast charger with CCS2 connectors, 10.1-inch touch display, app/QR/RFID/POS payment, OCPP integration, and smart-grid load management, starts from approximately R430,000 installed at the 60 kW configuration (indicative). The ChargePoint SA CP-DC160, a 160 to 300 kW ultra-rapid unit suited to high-throughput highway corridors, is quoted per site because civils, grid connection, and NMD upgrade costs vary too widely for a published figure to be meaningful. Both units support dual CCS2 (SANS 62196-3 compliant), cover the full 200 to 1,000 V range that accommodates every modern EV sold in South Africa, and include remote OTA management.
| Configuration | Hardware + install (indicative) | Total site cost range | Grid connection requirement |
|---|---|---|---|
| Entry 47 kW DC (single gun) | R400,000 to R525,000 | R500,000 to R900,000 | ~75 kVA NMD upgrade |
| 60 to 120 kW DC dual-gun (CP-DC60) | From ~R430,000 installed | R600,000 to R1,200,000 | ~100 to 175 kVA NMD |
| 150 kW DC (Rubicon Canal Walk benchmark) | Quoted per site | ~R1,500,000 | ~220 kVA NMD |
| 160 to 300 kW ultra-rapid (CP-DC160) | Quoted per site | R1,500,000 to R2,500,000+ | ~250 to 450 kVA NMD |
| 200 kW DC (Rubicon Mall of Africa benchmark) | Quoted per site | ~R2,500,000 | ~300 kVA NMD |
Note: NMD figures are illustrative. Your actual Notified Maximum Demand will depend on existing site capacity, cable run length, and whether Eskom or your municipality supplies. Installation costs are quoted per site and vary with DB board capacity, cable run, phases, civils, and any network reinforcement works required.
The Eskom grid cost most forecourt operators underestimate
The hardware and civils are a once-off spend. The Eskom grid cost is a permanent structural cost that operators frequently underestimate when they see the hardware specification sheet.
Any DC fast-charger site above 100 kVA, which describes every 60 kW-plus installation, falls into Eskom’s Miniflex or Megaflex tariff band (Eskom Application Tool reference page). Both are time-of-use (TOU) tariffs. Before Eskom will even issue you a cost estimate, you pay a non-refundable Cost Estimate Fee (CEF) based on the incremental NMD capacity required (Eskom 2025/26 Schedule of Standard Fees, effective 1 April 2025). If you later change your NMD, you restart the quotation process entirely.
Once connected, demand charges accrue every month regardless of whether your charger is busy. For the 2026/27 financial year, Eskom Megaflex network demand charges are R52.65/kVA/month in the high-demand season and R26.29/kVA/month in the low-demand season (Eskom 2026/27 tariff schedule). A site with a 200 kVA NMD therefore carries a monthly demand charge of roughly R10,530 in winter, before a single kilowatt-hour of energy is billed.
The 2025/26 restructure also phased in a new Generation Capacity Charge (GCC): 20% in 2025/26, rising to 30% in 2026/27, with the remainder recovered through the energy charge. Broadreach Energy calculated that Megaflex customers faced real-world bill increases of up to 18% in 2025, even though the NERSA-approved headline rate was 12.74%, because the approved figure covers only the energy component and excludes structural tariff changes and new components. Eskom then increased tariffs a further 8.76% from 1 April 2026 and 9.01% from 1 July 2026.
If your demand ever exceeds the NMD, Eskom levies an Excess Network Capacity Charge: the number of exceedance events multiplied by the demand above your NMD, multiplied by the sum of the Distribution network capacity charge plus the Transmission network charge (Eskom Schedule of Standard Prices 2025/26). On a 150 kW charger with two vehicles simultaneously charging, a short exceedance can trigger a meaningful penalty bill.
This is precisely why Rubicon has actively avoided investing in Pretoria. The city’s Basic Charge policy makes EV charging installations financially unviable there, and operators have structured their networks around it (ChargePoint SA, April 2026).
The utilisation reality and what break-even actually requires
“We’ve got a site at Canal Walk in Cape Town, which is 150 kilowatt DC, that’s about R1.5 million. According to Rubicon’s number crunching, it would take eight to 10 charging sessions per day over three years for the investment in an installation like the one at Canal Walk to be paid back in full. So that doesn’t sound too bad, but you need a lot of sessions at the charger to realise that number and if you’ve got a network of 250 chargers out there. You’ve invested a lot of money… it’s going to take a long time.”
Eight to ten sessions per day sounds achievable. The problem is the gap between that target and reality. Winstone Jordaan told TechCentral in January 2025 that the entire South African public network, across every operator, was processing just under 5,000 charge sessions per month. Spread across roughly 400-plus publicly accessible chargers, that implies an average of roughly 1.5 to 2.5 sessions per charger per day. That is the network average; busy urban chargers outperform it, while rural route-openers sit well below it.
“There are just under 5,000 charge sessions per month on the public network. If we include the home-charging stations, then we can estimate that at least 3.5 million kilometers are driven in electric cars in South Africa every month.”
Globally, research by Stable Auto (2024) identifies a 15% utilisation rate, roughly five hours of active charging per day per charger, as the break-even tipping point. At the R7.00 per kWh retail tariff that Rubicon eMSP customers pay for DC charging (a rate that reflects August 2025 pricing; note that GridCars implemented approximately a 15% increase from 1 December 2025 and current 2026 retail rates may be higher), a 150 kW charger running at average South African network utilisation generates revenue far short of the demand charge, O&M, software, and capex recovery needed.
The cost-of-ownership comparison below uses illustrative figures from ChargePoint SA’s revenue model. Actual numbers depend on your site, municipality, NMD, and tariff structure and should be verified with a formal site assessment.
| Metric | Low utilisation (~30 kWh/day) | Target utilisation (Canal Walk model: ~8 sessions/day) | Captive fleet depot (~350 kWh/day) |
|---|---|---|---|
| Daily energy dispensed | ~30 kWh | ~240 kWh (8 × 30 kWh avg) | ~350 kWh |
| Monthly energy revenue (at R7/kWh indicative) | ~R6,300 | ~R50,400 | ~R73,500 |
| Monthly demand charge (200 kVA Megaflex, illustrative) | ~R8,000 to R10,530 | ~R8,000 to R10,530 | ~R8,000 to R10,530 |
| Monthly O&M + software (indicative) | ~R3,500 | ~R3,500 | ~R3,500 |
| Implied payback on R1.5m capex | Never (negative margin) | ~3 years (matches Rubicon’s model) | ~1.2 years |
The captive fleet depot scenario, where a logistics operator, a bus company, or a municipality charges its own vehicles overnight, guaranteeing daily throughput, is the clearest near-term business case. Public forecourt charging at current South African EV fleet levels is a long-range infrastructure bet, not a short-term revenue play.
The tariff layering that drivers see, and why it matters to your revenue model
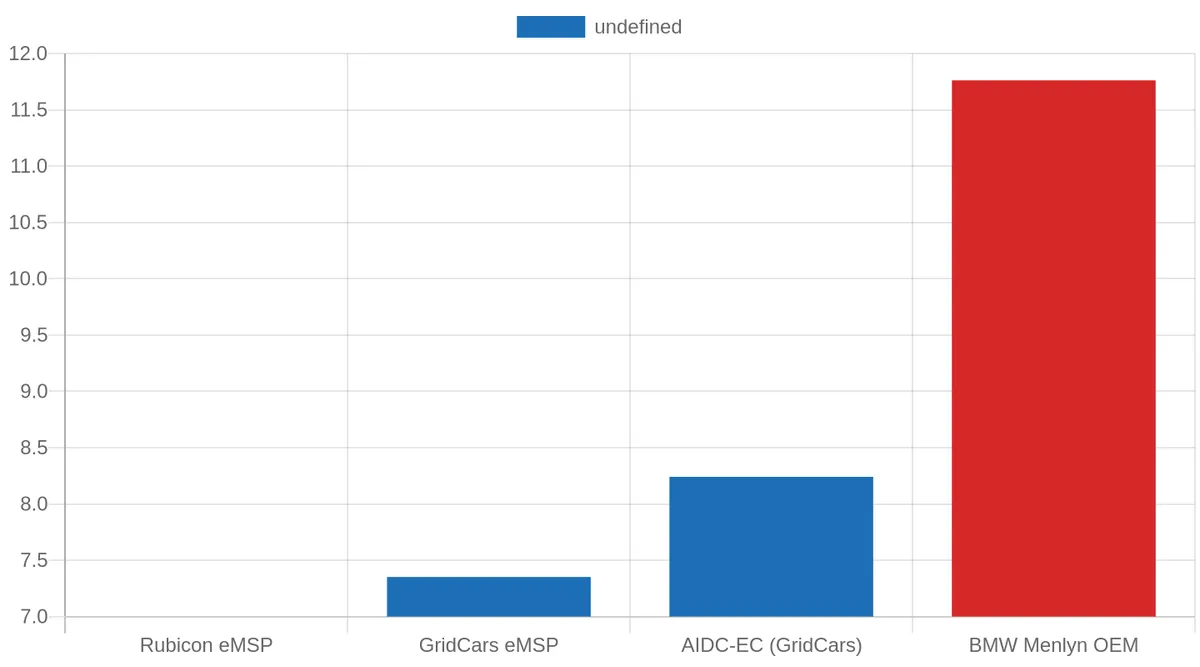
“Think of it like the fibre internet model. The fibre network providers, like Openserve or Vumatel, sell bandwidth to internet service providers such as Afrihost or MWeb, who then add their margin before offering it to customers. Public EV charging works in much the same way.”
As a forecourt operator, you will sit in the Charge Point Operator (CPO) role. An e-mobility service provider (eMSP) such as GridCars or Rubicon’s own eMSP then sells access to your charger to their subscribers, adding roughly 15% on top of your wholesale tariff before VAT (CleanTechnica, quoting Hilton Musk, November 2025). The retail tariff your customers see is that layered price, not your wholesale rate.
This creates a tension. You need a high enough wholesale tariff to cover your grid costs, O&M, and capex recovery. The eMSP adds its 15% and VAT. The driver then compares that retail price against home charging at R3.40 to R4.20 per kWh (municipal indirect customers, ChargePoint SA). On a 70 kWh EV battery, home charging costs roughly R245. A public DC fast-charge at current rates costs roughly R515-75% to 140% more expensive per kWh (EV24.africa / ChargePoint SA). Drivers accept that premium for the speed and convenience of a rapid top-up, not as a substitute for daily home charging.
This is the core structural insight: your DC fast charger competes with home charging for routine top-ups, and it loses. It wins only for road-trip fill-ups, emergency top-ups, and apartment dwellers without home charging access.
Greg Blandford identified the practical implication directly:
“The hard part is finding the right place to maximise the number of cars that will use that station, so traffic flows and EV concentration are important factors.”
Understand tariff structures and revenue models for DC sites
Smart chargers, Dynamic Load Management, and avoiding grid upgrade costs
“You’ve got to stop the installation of dumb chargers. You need smart, connected chargers to avoid what happened in the UK, where they had to ban 200,000 dumb units after rollout. We have the chance to get it right from the start.”
A non-networked or “dumb” DC charger draws its full rated power every time a vehicle connects, regardless of what else is happening on your site. If your filling station simultaneously has fuel pumps, lighting, refrigeration, a canopy, and a DC charger running, an unmanaged charger can push your demand above your NMD, triggering an Excess Network Capacity Charge from Eskom on every exceedance event.
Smart chargers with Dynamic Load Management (DLM) communicate with your site’s load controller in real time. When total site demand approaches the NMD threshold, the system throttles charger output, delivering, say, 40 kW instead of 60 kW, rather than exceeding the limit. This can eliminate NMD exceedance penalties entirely and, critically, may allow you to install a higher-powered charger without applying for a larger NMD, avoiding the Eskom Cost Estimate Fee, connection upgrade charge, and the one-to-twelve-month connection timeline (EnergyBee, 2026).
GridCars deployed its Local Smart Charge Controller (LSCC) specifically to enable dynamic load balancing in high-density environments, marketing it explicitly as a substitute for network reinforcement capital expenditure (GridCars official website). The ChargePoint SA CP-DC60 and CP-DC160 both include smart-grid integration and OCPP connectivity as standard, enabling this kind of real-time load management from day one.
NERSA’s draft Electricity Trading Rules, published 24 November 2025, require advanced metering infrastructure capable of automated, real-time TOU readings at EV charger sites (ChargePoint SA, citing NERSA draft rules, 2025). If your municipality’s metering infrastructure does not yet meet that standard, session-level billing compliance may become a regulatory issue. Specifying OCPP 2.0.1-compliant hardware now, as both the CP-DC60 and CP-DC160 provide, positions your site ahead of that requirement.
The off-grid alternative: bypassing Eskom entirely
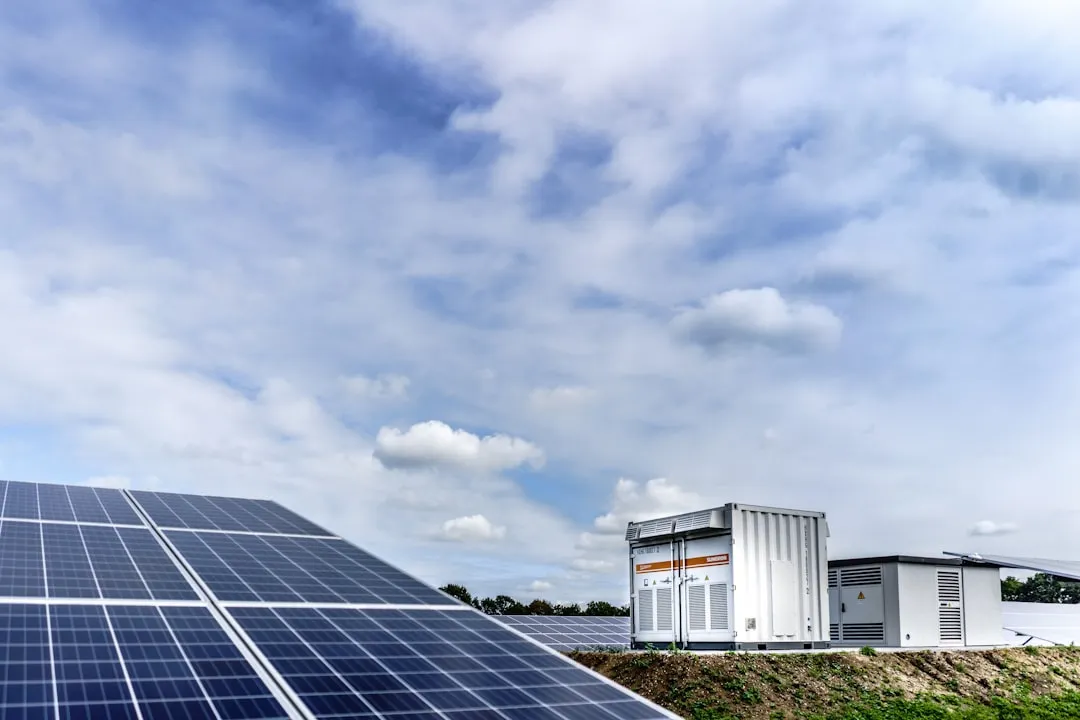
“If you go into EV charging, it’s not to make revenue. We are completely off-grid… we do not have a middleman selling electricity, which if you’re grid-dependent, you are subject to inflation increases.”
South Africa’s first fully off-grid EV charging station launched on 28 November 2024, built by CHARGE next to the N12 near Wolmaransstad in North West (DriveElectric, November 2024). The site uses 480 bifacial solar panels generating up to 280 kW, a 546 kWh liquid-cooled battery, and a 250 kVA HVO-fuelled backup generator. There is no Eskom connection, no CEF, no NMD, and no monthly demand charge.
The Development Bank of Southern Africa provided equity investment to CHARGE with the condition that the company must build off-grid charging infrastructure every 150 km along major national roads (ChargePoint SA, April 2026). CHARGE has a R2.3 billion plan to build 120 such stations, a direct acknowledgment that grid connection costs and tariff inflation make rural on-grid installations uneconomical at current EV fleet volumes.
For highway service plazas and roadside filling stations in areas where grid connections are expensive, slow to obtain, or subject to unreliable municipal supply, the off-grid model deserves serious consideration. A UNISA study of a 60 kW solar PV and 150 kWh storage system paired with six Level 2 chargers found an NPV of R2.3 million, an IRR of 11.2%, and a payback period of 4.2 years, against 6.8 years for grid-only (EV24.africa, citing UNISA Florida campus study, December 2025). DC fast-charging adds storage cost but further compresses dwell time and improves revenue per session. Notably, 42% of GridCars’ chargers already use solar as of 2025 (ESI Africa, quoting Winstone Jordaan, Enlit Africa 2025).
The non-charging-fee revenue model: why site context matters as much as charger spec
“We’re bringing foot traffic and high LSM clients to malls. They’re spending more time there… now they’re charging their cars. They have to spend 30 to 45 minutes at the charger. They’re going to spend more money. They’re going to go to a coffee shop, they’re going to buy some cake and tea, and they might go do some shopping.”
This is the model that makes public DC charging viable at current South African utilisation rates: the energy revenue does not carry the investment alone. The landlord or property owner receives value in the form of dwell time, foot traffic, and a premium-customer draw. In a mall context, that value can be quantified and either monetised as a rental subsidy or embedded in the CPO’s commercial agreement with the property.
For a filling station operator, the equivalent value is the forecourt spend, the driver who fills up on electricity also buys a coffee, a meal, and perhaps fuel for a companion vehicle. If you can model and present that ancillary spend to your finance committee, the effective return on the DC charger investment improves materially. The 30 to 45 minutes a DC fast-charge requires is longer than a petrol fill and shorter than a full meal stop, a structurally ideal dwell time for forecourt retail.
“Interestingly, as Winstone’s alluded to, the use case and the adoption rate of charging in public environments is so, so important. Over time you start to see the adoption of specific sites and utilisation rates of those sites. And that’s critically important to present a business case.”
The growth trajectory: is the timing right?
Total public charging sessions doubled in 2024 versus 2023 (TechCentral, citing Rubicon data). Rubicon’s network processed 21,606 transactions in 2025, up 159% from 8,338 in 2024, and dispensed 625 MWh of energy, up 142% year-on-year (CleanTechnica, February 2026). New EV sales increased 82.7% in Q1 2024 versus Q1 2023 (NAAMSA, cited by BusinessWire). The BYD Dolphin recorded 239 units sold in its first month of formal NAAMSA reporting in March 2026, immediately becoming South Africa’s best-selling BEV in that month (ChargePoint SA, 2026 guide). Total BEV volume for 2025, including non-reporting Chinese brands, is estimated at 7,000 to 10,000 units (ChargePoint SA).
South Africa’s 150% tax reclaim on EV manufacturing investments, which took effect in March 2026, is expected to reduce vehicle costs over time and accelerate fleet growth. That fleet growth is the direct driver of charger utilisation. The operators who install infrastructure now, before utilisation reaches break-even, position their sites as the established network when fleet volumes cross the threshold. The operators who wait for profitability to appear before investing will find the prime sites already taken.
Eskom’s shift from first-come, first-served to a first-ready, first-served grid allocation model under the Interim Grid Capacity Allocation Rules (ICGAR), updated in March 2025 (Bowmans Law, April 2025), means that grid connection timelines reward prepared applicants. If you are planning a 150 kW site, beginning the Eskom CEF application process and securing your NMD now has tangible queue-position value.
Standards and compliance: what every SA forecourt installation must meet
If you manage a filling station, service plaza, or fuel retail network, the compliance framework is non-negotiable and forms part of your risk management, not just your regulatory obligation.
- DC connectors must comply with SANS 62196-3. CCS2 is the dominant standard for modern EVs sold in South Africa; CHAdeMO remains relevant for legacy Nissan Leaf fleet vehicles. Both the CP-DC60 and CP-DC160 support CCS2 as standard, with CHAdeMO available as an option.
- AC connectors (if you add destination AC charging for staff vehicles or overnight fleet) must comply with SANS 62196-2.
- All electrical installation work must comply with SANS 10142-1, the South African wiring code, and must be signed off by an ECSA-registered electrician issuing an electrical Certificate of Compliance (CoC). Without a CoC, your insurance is exposed and your municipality will not energise the connection.
- Eskom’s ICGAR first-ready criteria require documented engineering readiness before your connection application will be prioritised.
ChargePoint SA supplies and installs its own DC fast-charger range under a single accountable contract that includes SANS 10142-1 wiring compliance, electrical CoC, and ECSA-registered installers as standard. This matters specifically in the forecourt context because your fuel retailer’s licence and premises insurance both assume electrical compliance; a non-compliant charger installation creates a gap in your cover.
Cost-of-ownership comparison: grid-connected vs off-grid vs AC destination
| Factor | Grid-connected DC fast (150 kW) | Off-grid DC fast (280 kW solar + 546 kWh battery) | AC destination (22 kW, 4-bay) |
|---|---|---|---|
| All-in capex (indicative) | ~R1,500,000 | ~R3,500,000 to R5,000,000 | R250,000 to R500,000 |
| Monthly demand charge | R8,000 to R10,530 (Megaflex, 200 kVA) | Nil (no grid connection) | Lower band (sub-100 kVA, Miniflex or municipal) |
| Energy cost per kWh (to operator) | R2.10 to R3.50 (Miniflex TOU peak/off-peak blend) | Solar LCOE ~R0.80 to R1.20 (storage increases cost) | R2.10 to R3.50 (same tariff band) |
| Tariff inflation exposure | High (8.76% April 2026 + 9.01% July 2026) | Minimal (fuel for generator backup only) | Moderate |
| Session time (per vehicle) | 20 to 45 minutes | ~25 minutes | 1 to 4 hours |
| Break-even sessions/day needed | 8 to 10 (Rubicon Canal Walk model) | Higher capex requires higher throughput; DBSA model assumes corridor volumes | Lower (AC capex is lower; suitable for dwell-time locations) |
| Best fit | High-traffic urban forecourt, captive fleet depot | Rural highway, areas with weak/costly grid, off-grid corridor | Hotel, mall destination, workplace, estate |
Frequently asked questions
How much does it cost to install a DC fast charger at a South African filling station?
All-in site costs range from R500,000 to R2,000,000 or more, depending on charger power, cable run length, civil works, and grid connection cost. Rubicon’s publicly stated benchmarks are approximately R1.5 million for a 150 kW site at Canal Walk, Cape Town, and approximately R2.5 million for a 200 kW site at Mall of Africa, Johannesburg (Greg Blandford, Enlit Africa 2025). Hardware for a 60 kW unit starts from approximately R430,000 installed (indicative); installation labour alone starts at around R100,000 per unit in Gauteng before grid connection works.
How many sessions per day does a DC fast charger need to pay back in South Africa?
Rubicon calculates that its 150 kW Canal Walk site needs 8 to 10 charging sessions per day for three consecutive years to recover the R1.5 million all-in capex. The current South African public network average is roughly 1.5 to 2.5 sessions per charger per day (derived from GridCars/TechCentral January 2025 data showing just under 5,000 total public sessions per month). High-traffic urban sites and captive fleet depots outperform that average significantly; rural route-openers often sit well below it.
What Eskom tariff applies to a forecourt DC fast-charger site, and what are the ongoing charges?
A DC fast-charger site above 100 kVA falls into Eskom’s Miniflex (NMD from 16 kVA to 5 MVA) or Megaflex (NMD above 1 MVA) TOU tariff band (Eskom Application Tool reference page). Beyond the energy charge, you pay a monthly Distribution network capacity charge and a Transmission network charge on your annual utilised NMD, for the 2026/27 year, Megaflex demand charges run to R52.65/kVA/month in the high-demand season. If your demand exceeds your Notified Maximum Demand on any interval, Eskom levies an Excess Network Capacity Charge on each exceedance. Tariffs rose 8.76% from 1 April 2026 and a further 9.01% from 1 July 2026.
Can a forecourt operator install a DC fast charger that is completely off-grid?
Yes, and it has been demonstrated at commercial scale in South Africa. CHARGE (formerly Zero Carbon Charge) operates the country’s first fully off-grid DC fast-charging station near Wolmaransstad, North West, launched on 28 November 2024. It uses 280 kW of solar, 546 kWh of battery storage, and a 250 kVA HVO-fuelled backup generator, with no Eskom connection and therefore no monthly demand charge or tariff inflation exposure. The DBSA has provided equity to fund 120 such off-grid stations every 150 km along South Africa’s national road network (ChargePoint SA, April 2026). Off-grid has higher upfront capex but eliminates ongoing grid cost and connection timeline risk.
What compliance standards apply to a DC fast charger installed at a South African forecourt?
DC connectors must comply with SANS 62196-3 (CCS2 is the dominant modern standard; CHAdeMO covers legacy vehicles). AC connectors on the same site must comply with SANS 62196-2. All electrical installation work must comply with SANS 10142-1, the South African wiring code. The installation must be signed off by an ECSA-registered electrician who issues an electrical Certificate of Compliance (CoC), without this, the municipality will not energise the connection and your premises insurance may be invalidated. Smart chargers with OCPP 2.0.1 connectivity are also advisable in light of NERSA’s draft Electricity Trading Rules (published November 2025) requiring advanced metering infrastructure at charging sites.
Do I need a smart charger or can I install a basic DC unit to save cost?
You need a smart, networked charger. Winstone Jordaan of GridCars has warned explicitly that South Africa must not repeat the UK’s experience of deploying 200,000 unmanaged units that subsequently required a government ban on further “dumb” charger installations. A non-networked charger cannot perform Dynamic Load Management to protect against NMD exceedances, cannot be remotely monitored, cannot generate session-level billing data for OCPP/eMSP integration, and cannot be updated via OTA firmware. It is also increasingly incompatible with NERSA’s emerging advanced metering requirements. The short-term hardware saving is real; the long-term operational and regulatory cost is larger.
The bottom line for South African forecourt operators
If you manage a filling station or service plaza and you are evaluating DC fast charging today, the honest position is this: public forecourt DC charging in South Africa is not yet a short-term revenue business at average network utilisation rates. It is an infrastructure positioning play that rewards operators who select the right site, install smart compliant hardware, manage their grid costs aggressively, and capture the non-charging-fee value (dwell time, foot traffic, fleet contract revenue) to bridge the gap until EV fleet volumes cross the profitability threshold.
The threshold is not impossibly distant. Rubicon’s network processed 159% more transactions in 2025 than in 2024. BYD has begun reporting to NAAMSA. South Africa has introduced a 150% EV manufacturing investment tax reclaim from March 2026. The operators who install infrastructure and build utilisation data now will have a material advantage over those who wait.
The right hardware for a forecourt or fleet depot is smart, grid-aware, and OCPP-compliant from day one. The ChargePoint SA CP-DC60 (60 to 120 kW, from approximately R430,000 installed indicatively) suits mid-traffic sites and captive fleet depots. The CP-DC160 (160 to 300 kW, quoted per site) is the right choice for high-traffic highway corridors. Both comply with SANS 62196-3, include dual CCS2, support app/QR/RFID/POS payment, and are installed under a SANS 10142-1-compliant contract with electrical CoC by ECSA-registered installers. Installation pricing varies per site, grid connection, cable run, civils, and NMD upgrade all affect the final number.
To find out what a DC fast-charger site will realistically cost at your specific forecourt, what grid works you need, and what the payback looks like under your traffic profile, plan your site free with our Commercial Site Builder, you will get a recommended charger configuration, an indicative cost, and a payback model, and you can then book an engineered site assessment with an ECSA-registered engineer at no obligation.
Photo: Erik Mclean / Pexels
Plan a profitable DC fast-charging forecourt site
The Commercial Site Builder is free, with no obligation to proceed.
Plan my forecourt charging →WhatsApp us
CoC-certified installers, nationwide