
Key points
- Everlectric’s 12.5-million-kilometre South African dataset shows EVs deliver a 27% lower TCO than diesel equivalents when purchased outright, and 23% lower when financed, based on real deployments by Woolworths, FedEx, Vodacom, and DSV.
- TechCentral reports that with diesel crossing R30/L, fleets travelling more than 3,500 km/month now have a compelling financial case for electrification; Everlectric’s data puts the 1-tonne EV break-even at 3,200 km/month and 4- to 8-tonne EVs at 2,500 km/month.
- A fleet EV consuming 15 kWh/100 km costs approximately R37-R60 per 100 km on depot electricity rates, compared to approximately R210 per 100 km for a 9 L/100 km diesel vehicle at April 2026 fuel prices, meaning depot-charged EVs run significantly cheaper per kilometre than diesel equivalents.
- EV maintenance typically runs R200-R400/month (mainly tyres, wipers, and brakes) versus R800-R1,200/month for petrol and diesel vehicles, EVs have dramatically fewer moving parts that can fail, with an electric drivetrain containing roughly 20-30 moving parts compared to upwards of 2,000 in a full ICE drivetrain.
- An undersized depot electrical panel is the single most expensive mistake in fleet electrification: reworking incorrectly sized infrastructure costs 150% of the original installation and takes 12-24 months for utility upgrade approval.
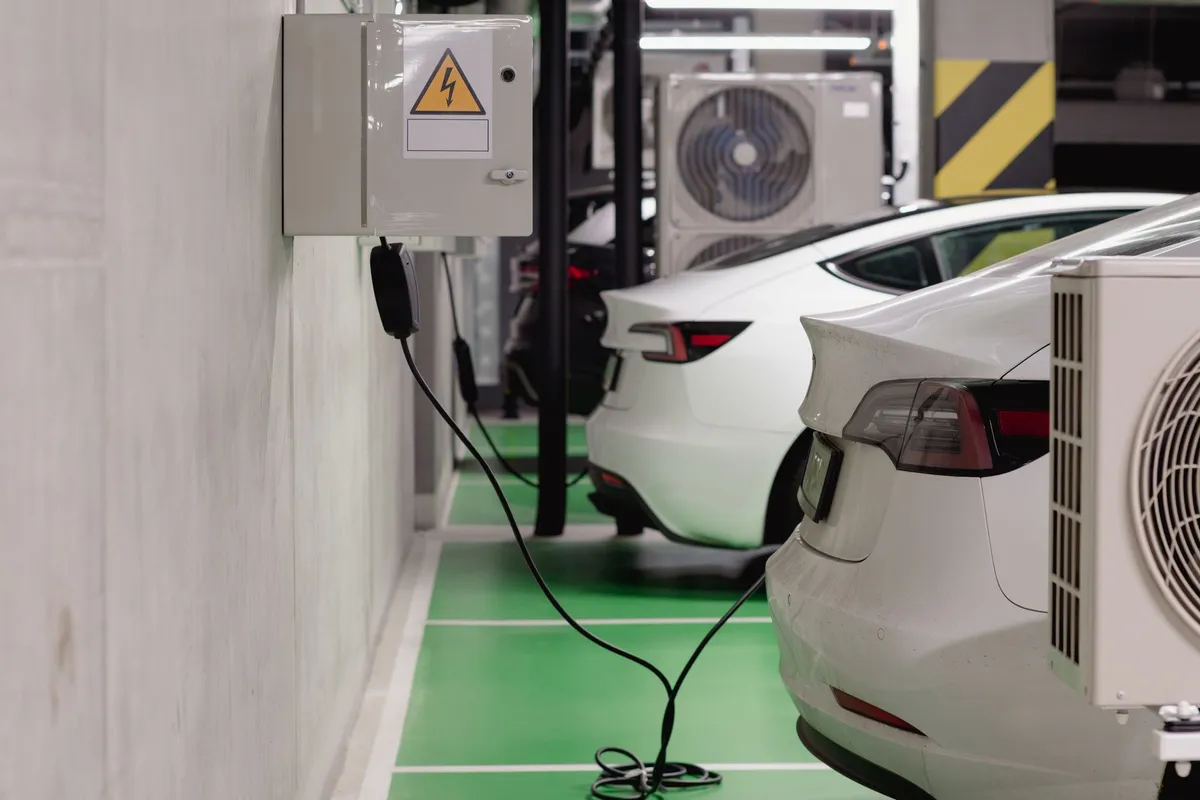
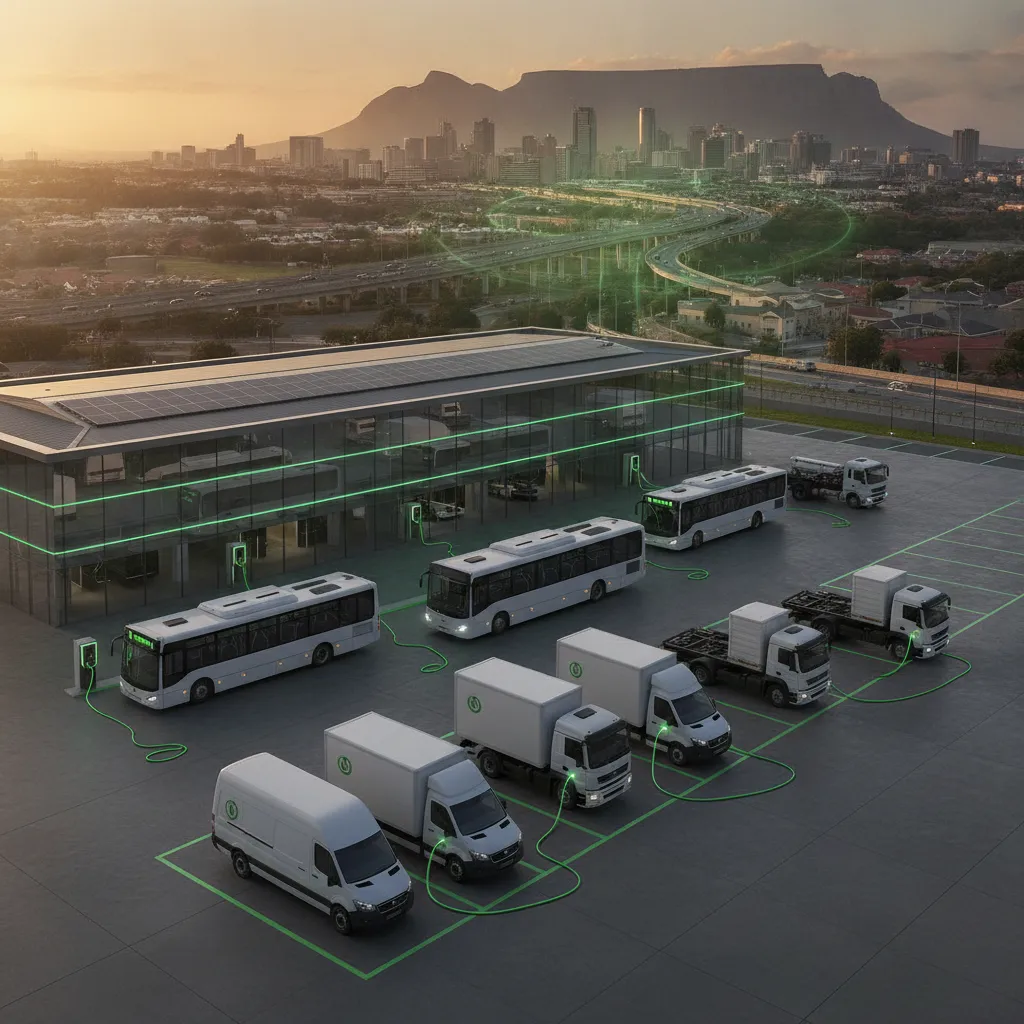
If you manage a fleet, you already know the sticker shock of electric commercial vehicles. What most procurement decisions miss is that the purchase price is the least useful number in a five-year cost model. The fuel bill, the maintenance schedule, the insurance premium, the residual value, and, critically, the cost of the depot charging infrastructure you build today all determine whether electrification actually improves your operating margin or merely shifts cost from the forecourt to the switchboard.
This article works through each of those costs using verified South African figures, gives you a practical formula for sizing depot charging infrastructure, and tells you exactly what compliance credentials to demand from any installer you appoint.
The real cost gap: EV versus diesel over five years
Anton Falck, Vice President of Hino at Toyota South Africa Motors, put the procurement trap bluntly: many fleet operators still expect EVs to have a very similar purchase price to the equivalent ICE unit and zero maintenance cost, both of which are inaccurate. The honest answer sits somewhere in between, and the data increasingly favours EVs for operators running intensive duty cycles.
The most credible SA-specific TCO comparison available comes from an EE Business Intelligence/Electric Mission webinar in May 2026, where Everlectric CEO Ndia Magadagela presented a head-to-head analysis of a diesel one-tonne double-cab bakkie (purchase price R380,000) versus an equivalent EV (R750,000) over five years and 240,000 km. The diesel’s total cost of ownership came to R1.26 million. The EV’s came to R860,000, a 27% TCO saving in favour of the electric vehicle, despite costing nearly twice as much to buy.
That 27% advantage is built on 12.5 million kilometres of real South African fleet operations, not a spreadsheet model. CleanTechnica’s analysis of the Everlectric dataset confirms that Woolworths, FedEx, Vodacom, DSV, Scatec, and UPD have all achieved EV TCO savings with 100% operational availability and no reported downtime or mechanical issues.
The Everlectric analysis used a R22/litre diesel baseline. TechCentral notes that with diesel crossing R30/L, the economics become, in the words of fleet specialists, overwhelming. Fuel price volatility is not abstract: petrol 95 inland peaked around R25/L in the 2022-2024 period before falling and then spiking again, a pattern that makes locking in a depot electricity cost per kilometre an increasingly attractive hedge.
| Metric | Diesel 1-tonne bakkie | EV equivalent |
|---|---|---|
| Purchase price | R380,000 | R750,000 |
| 5-year / 240,000 km TCO | R1,260,000 | R860,000 |
| TCO saving (EV vs diesel) | 27% (outright purchase) | |
| TCO saving (financed) | 23% | |
| Break-even (1-tonne fleet) | 3,200 km/month | |
| Break-even (4-8 tonne fleet) | 2,500 km/month |
Energy cost: depot charging versus the diesel pump
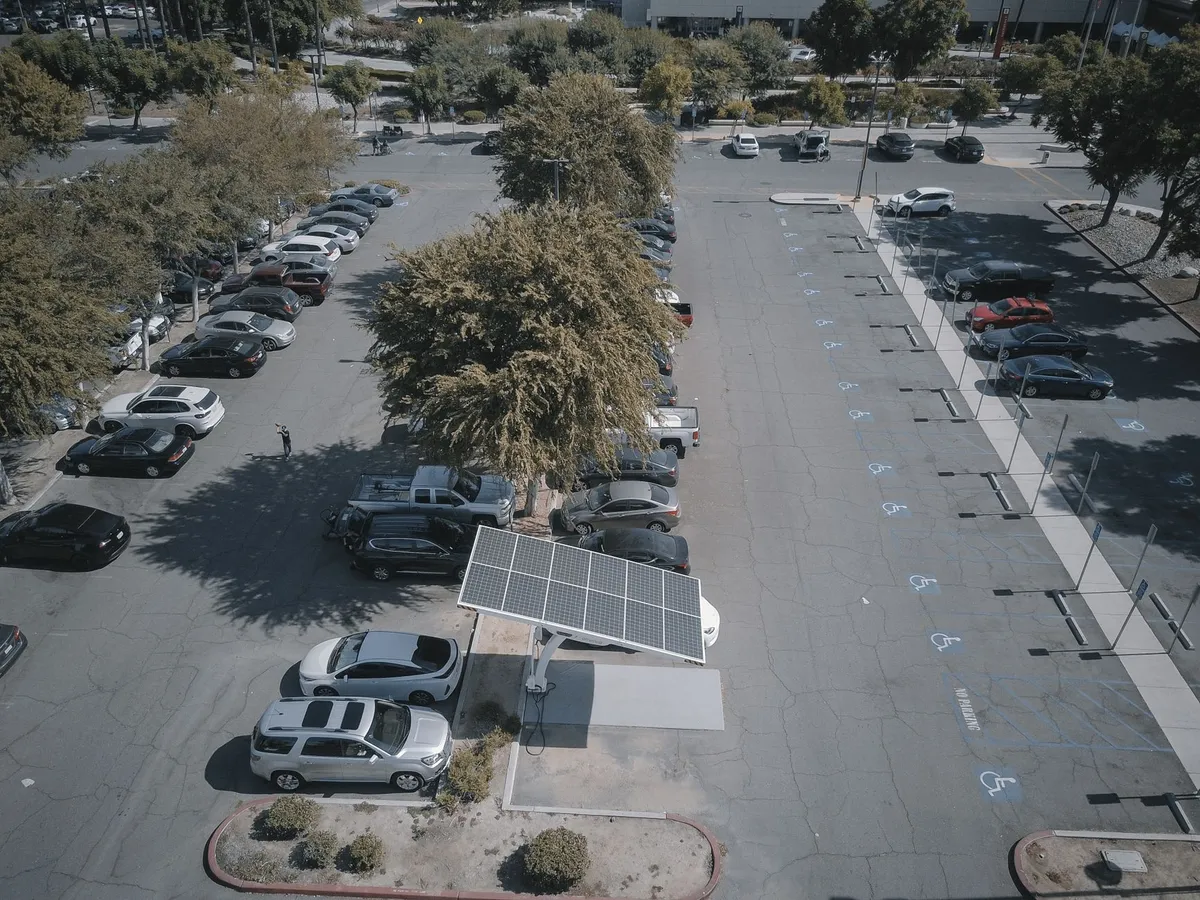
The fuel cost advantage is where the EV case becomes most concrete. Our complete EV guide for 2026 sets out the numbers clearly: a fleet EV consuming 15 kWh/100 km costs approximately R37-R60 per 100 km at depot electricity rates of R3.00-R4.00/kWh. A diesel vehicle doing 9 L/100 km costs approximately R210 per 100 km at April 2026 fuel prices (with diesel 50ppm tracking petrol 95 inland at approximately R23.36/L).
That means depot-charged EVs run at roughly a fifth of the fuel cost of a comparable diesel vehicle, and that advantage widens every time the diesel price spikes. AEVERSA’s fleet analysis confirms that commercial EVs can reduce operating costs by up to 50% on urban delivery routes, with light commercial EVs showing the strongest payback on stop-start inner-city cycles where regenerative braking compounds the energy efficiency advantage.
The key is keeping your fleet on depot electricity rather than public charging. Everlectric CEO Ndia Magadagela told Business Day that public AC charging in South Africa runs approximately R6.00/kWh, and public DC fast charging approximately R7.35/kWh, three to four times the cost of depot electricity. As the NREL finding cited by fleet infrastructure specialists shows, approximately 80% of a commercial fleet’s total energy consumption can be satisfied at the depot during scheduled dwell periods, with the remaining 20% drawn from en-route public or partner DC fast charging.
On Eskom’s Megaflex tariff, the most relevant structure for large depot operators, loads shifted to off-peak periods avoid both the maximum demand charge and reactive power charges. The Megaflex network demand charge runs R52.65/kVA/month during high-demand season (June to August) and R26.29/kVA/month during the low-demand season. A single poorly-timed simultaneous plug-in event can set the demand charge for the entire monthly bill, which is why smart charging software is not optional at scale.
Maintenance and reliability: what the moving-parts argument actually means in practice
The lower maintenance cost of EVs is real, but it needs context. EVs have dramatically fewer moving parts than diesel vehicles: an electric drivetrain contains roughly 20-30 moving parts compared to upwards of 2,000 in a full ICE drivetrain, and an electric motor typically has just 2 moving parts versus hundreds in a diesel engine. The practical consequence is fewer failure points, longer service intervals, and no engine oil changes, no transmission servicing, and no exhaust after-treatment.
In South African fleet operations, EV maintenance typically runs R200-R400/month (mainly tyres, wipers, and brakes), compared to R800-R1,200/month for petrol and diesel equivalents covering services, oil changes, filters, and exhaust systems. Everlectric notes that service intervals for commercial EVs in South Africa typically fall every 30,000 km, with no engine oil or complex transmission maintenance to schedule.
The caveat that any honest fleet advisor will give you: tyres and brakes still wear, batteries degrade over time (though commercial fleet battery warranties typically run 6+ years), and insurance on a higher-purchase-price EV still runs R1,200-R2,500/month, currently higher than ICE equivalents because insurers are still pricing in the elevated replacement cost. The WattSpot network, which supports 240 EVs across three Gauteng depot sites, reported 18,884 charging sessions and more than 2 million kilometres covered with no service disruption, the reliability benchmark that procurement teams need to see before committing to electrification.
Calculate your fleet’s energy cost per kilometre versus diesel
Right-sizing your depot: the infrastructure calculation that makes or breaks the TCO

The purchase price and fuel savings are the easy part of the EV TCO calculation. The depot charging infrastructure, what it costs to build, how it affects your electricity bill, and whether it can actually charge your fleet in the hours available, is where most operators make expensive mistakes.
Start with your charging window, not your charger count
The first question is not how many chargers you need. It is how many hours your vehicles dwell at the depot between shifts. An overnight fleet with 8+ hours of dwell time between shifts is the simplest case: a 7.4-22 kW Level 2 AC charger can restore a 60-80 kWh delivery van battery in approximately 6-8 hours on an 11 kW charger. For that scenario, a smart-charging system with a 0.6-0.7 diversity factor (meaning not all vehicles charge simultaneously at full power) allows a 50-vehicle fleet to operate with 25-33 chargers rather than 50, reducing hardware and infrastructure cost by 30-40%.
Multi-shift operations change the equation entirely. If inter-shift dwell windows are short, 30 minutes of Level 2 charging at 11 kW adds only 5.5 kWh, you need DC fast chargers in the 50-150 kW range to top up batteries between shifts. One DC fast charger can serve 3-6 vehicles depending on dwell window and power level, but each unit draws significantly more power from your upstream infrastructure.
The panel sizing calculation
For a 10-vehicle fleet using Level 2 chargers at 40A each, the connected load is 400A. Applying a 70% simultaneous-use diversity factor gives an effective demand of 280A, but you must also apply a 1.25x multiplier to charger rated current when sizing cable and protective devices, because EV charging is classified as a continuous load under IEC 61851-1 and SANS 10142-1. Size your infrastructure 20% above calculated peak load to allow for fleet growth, additional vehicles, and future battery energy storage (BESS) additions.
The recommended charger mix for a 50-truck mixed-shift depot with managed scheduling is 35 Level 2 AC chargers plus 5 DC fast chargers. Dynamic load balancing becomes non-negotiable for any depot running more than 10 chargers, without it, a single simultaneous plug-in event during a peak billing period can add hundreds of rands to your monthly Eskom demand charge.
The rework cost that kills payback models
Getting the panel size wrong is the single most expensive mistake in depot electrification. Reworking incorrectly sized infrastructure costs 150% of the original installation cost, and utility upgrade approvals in South Africa can take 12-24 months to process. That delay does not just hurt your budget, it can push your TCO break-even point out by two to three years, turning a sound investment into a difficult one.
All South African depot charger installations require SANS 62196-2 (AC connectors), SANS 62196-3 (DC connectors), and SANS 10142-1 wiring code compliance. An electrical Certificate of Compliance (CoC) is mandatory, and the work must be signed off by ECSA-registered installers. Charger hardware must meet OCPP 1.6J as a minimum (OCPP 2.0.1 preferred), without an open protocol, your hardware is locked to a single manufacturer’s ecosystem and you lose the ability to switch software platforms or integrate load management tools as your fleet grows.
The DBSA’s R50 million investment in Zimi’s turnkey fleet electrification model, which bundles EVs, depot charging, solar, and energy management into a single contract, reflects the same logic: getting the infrastructure design right from day one is far cheaper than retrofitting a depot that was sized for five vehicles when you have thirty.
Load-shedding and the case for solar-backed depot charging
Load-shedding is the variable that most offshore fleet TCO models miss entirely, and it is the variable that matters most for South African depot operators. A Stage 4 load-shedding schedule can eliminate 4-6 hours of overnight charging window, which is significant if your vehicles are relying on off-peak rates to complete a full charge before the morning shift.
The practical response is a solar-plus-BESS depot charging configuration. Zero Carbon Charge has demonstrated the model at scale with two solar-powered, off-grid fast-charging hubs on the N3 freight corridor, backed by R100 million from the DBSA. Each hub charges up to eight EVs and trucks simultaneously using stored solar energy, effectively decoupling the charging window from Eskom’s load-shedding schedule.
For a depot operator, the economics of solar-backed charging work like this: solar generation during the day charges a BESS bank, which discharges into the fleet during the off-peak overnight window. The depot avoids both the peak Eskom tariff and the demand charge that would otherwise apply if vehicles charged during the Eskom high-demand peak (06:00-09:00 and 17:00-21:00 on weekdays during June, August). Eskom’s TOU restructuring effective 1 April 2025 extended the evening peak from two hours to three hours, a direct incentive to shift depot charging further into the off-peak window, or to use stored solar energy to cover the extended peak period.
What does a well-run SA fleet EV deployment actually look like?
South Africa’s first dedicated commercial fleet EV charging network, WattSpot, recorded 18,884 charging sessions and dispensed 205,845 kWh across three Gauteng depot sites, Wynberg, Northgate, and Fourways, between December 2025 and February 2026. The network supports Valternative Energy’s EV4 programme of 240 vehicles, which has cumulatively covered more than 2 million kilometres with no service disruption. WattSpot’s 60 kW DC fast charger sites operate 12-14 hours per day, with national expansion targeting more than 200 charge points at high-traffic fleet locations, with Durban next in line sized for an incoming fleet of 66 vehicles.
That real-world data matters because it answers the reliability objection before it is raised. A 98.5% uptime rate across three depot sites, running 60 kW DC fast chargers for 12-14 hours a day, means EV fleet downtime is not a material operational risk when the infrastructure is correctly specified and installed.
AutoTrader EV search interest in South Africa grew 220% between March 2025 and March 2026. Google keyword searches for EVs more than doubled entering 2026. The fleet operators who have already made the switch, Woolworths, FedEx, Vodacom, DSV, are not doing so for sustainability optics. They are doing it because the numbers work, and the gap between EV and diesel operating costs widens with every diesel price movement.
Ready to work out whether your fleet hits the break-even threshold, and what your depot would need to support the transition? Get your free commercial charging site plan, our ECSA-registered team will assess your fleet size, shift patterns, and grid connection, and give you a fixed-scope depot charging proposal with SANS 10142-1 certification and a full electrical CoC included.
Frequently asked questions
At what monthly mileage does an EV fleet break even with diesel on total cost of ownership?
For a 1-tonne light commercial vehicle, the break-even point is approximately 3,200 km/month (around 38,400 km/year). For 4-tonne and 8-tonne commercial vehicles, the break-even falls to approximately 2,500 km/month. These figures come from Everlectric’s dataset of 12.5 million kilometres of South African fleet operations.
What is the real energy cost advantage of depot charging versus diesel?
At depot electricity rates of R3.00-R4.00/kWh, a fleet EV consuming 15 kWh/100 km costs approximately R37-R60 per 100 km. A 9 L/100 km diesel vehicle costs approximately R210 per 100 km at April 2026 fuel prices. Keep vehicles on depot charging, public DC fast charging at approximately R7.35/kWh erodes the advantage materially.
What are the key compliance requirements for a South African depot charger installation?
All installations must comply with SANS 62196-2 (AC connectors), SANS 62196-3 (DC connectors), and SANS 10142-1 (the South African wiring code). A Certificate of Compliance (CoC) is mandatory, and the work must be executed and signed off by ECSA-registered installers. Charger hardware must support OCPP 1.6J as a minimum.
How does load-shedding affect depot EV charging?
Stage 2-6 load-shedding can eliminate 4-6 hours of overnight charging window, which affects whether vehicles can complete a full charge before the morning shift on grid power alone. The recommended mitigation is a solar-plus-BESS configuration that stores solar generation during the day and discharges it into the fleet overnight, decoupling your charging window from Eskom’s schedule.
What is the cost of getting depot infrastructure sizing wrong?
Reworking incorrectly sized depot infrastructure costs 150% of the original installation, and utility upgrade approvals can take 12-24 months. A correctly engineered site assessment, sizing charger count, kW per bay, transformer capacity, and load management configuration to your actual fleet and shift pattern, is far cheaper than a retrofit.
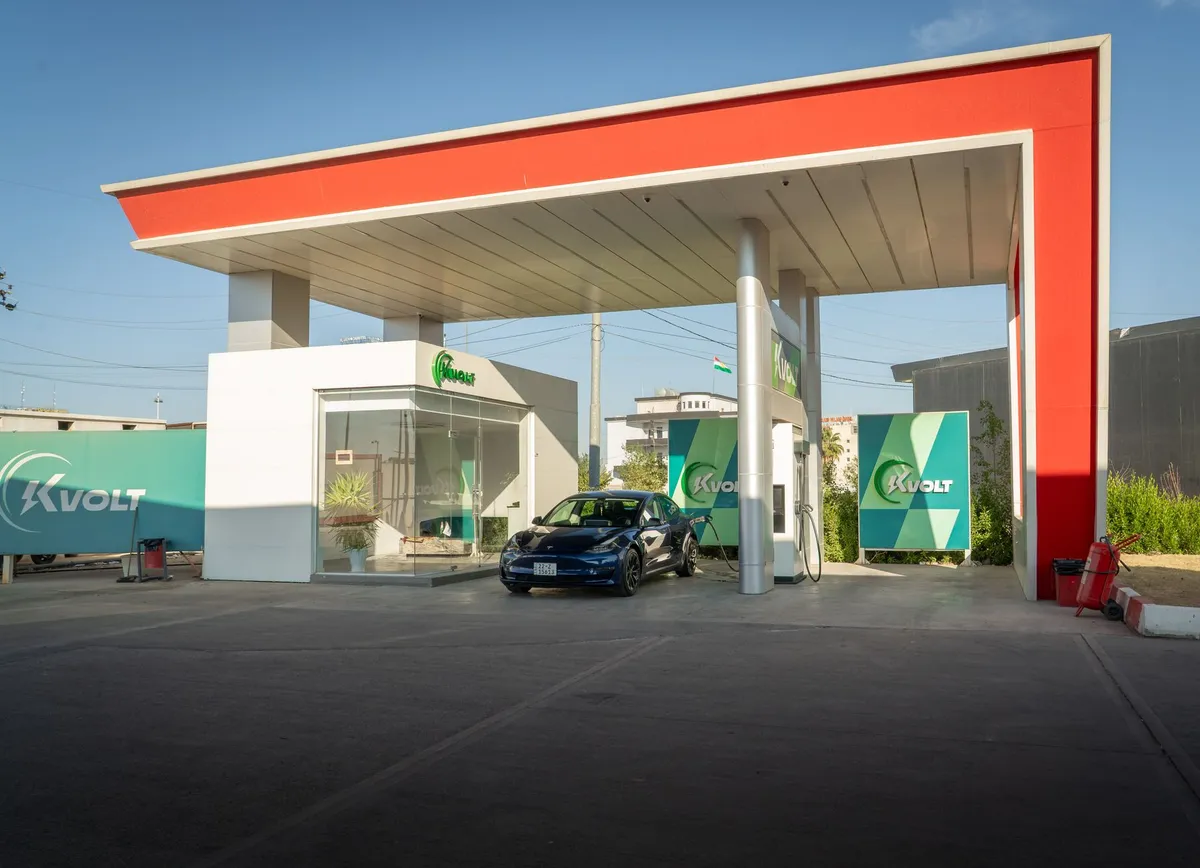
Photo: 04iraq / Pexels
Plan your fleet’s depot charging to unlock 27% TCO savings
The Commercial Site Builder is free, with no obligation to proceed.
Plan my depot charging →WhatsApp us
CoC-certified installers, nationwide