- A single commercial AC point costs from roughly R25,000 installed; a DC fast-charging site runs R500,000 to R2,500,000 all-in, depending on power and civil works.
- On-site depot charging costs approximately R4.50/kWh. Public DC fast charging was R7.00 to R7.35/kWh as at August 2025 (those rates have since risen by approximately 15% from December 2025).
- Unmanaged DC fast chargers can spike your Eskom NMD in a single 30-minute window and lock in excess capacity charges for up to 12 rolling months.
- Every installation in South Africa requires a Certificate of Compliance under SANS 10142-1, connectors must meet SANS 62196-2 (AC) or SANS 62196-3 (DC), and work must be carried out by an ECSA-registered installer.
- The WattSpot fleet depot network dispensed 205,845 kWh across 18,884 sessions at three Gauteng sites between December 2025 and February 2026, showing that captive depot DC charging can achieve genuine scale.
- Smart, OCPP-connected chargers are not optional. Industry leaders warn that non-connected units will need to be replaced, just as 200,000 dumb units were banned in the UK.
The commercial charging decision in plain terms
If you manage a fleet, run a logistics depot, operate a hotel with a company pool car, or oversee a corporate campus, the choice between AC Level 2 and DC fast charging is not a technical question. It is a capital allocation question with a ten-year tail. Get the infrastructure wrong and you pay twice: once for the wrong hardware and again for the demand charges, NMD penalties, and lost operational hours that follow. This guide works through the real numbers so you can make the right call the first time.
AC versus DC: what actually happens at the charger
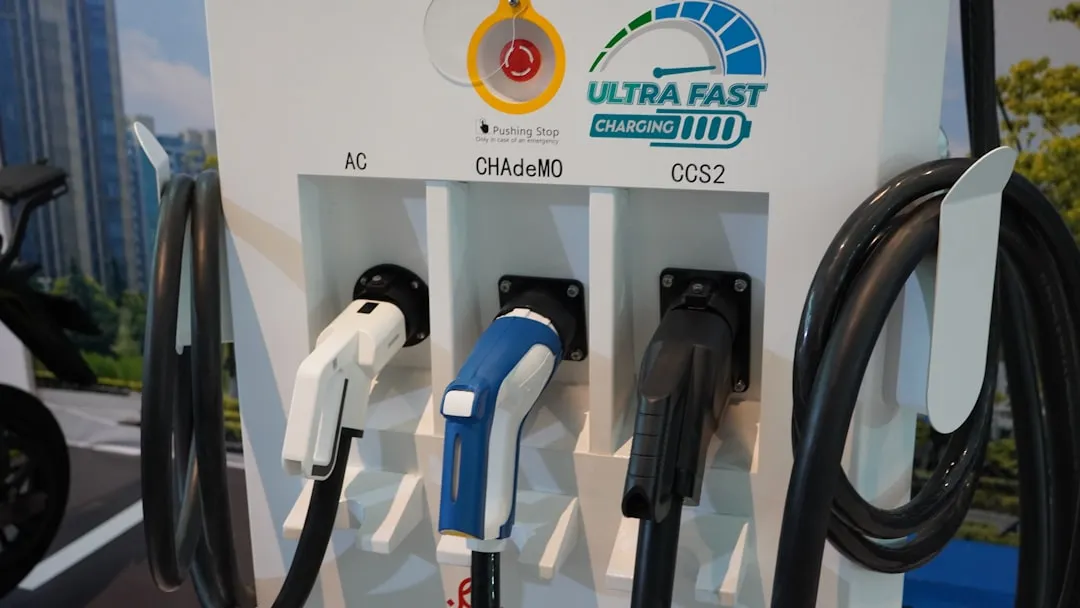
The difference matters for your electricity bill, not just your charge time. An AC charger (sometimes called a Level 2 wallbox or EVSE) is essentially a smart switch. It tells the vehicle how much current is available, then passes AC power directly to the car. The vehicle’s onboard charger does the AC-to-DC conversion. As EV Charge South Africa explains, the charge rate is therefore limited by the vehicle’s onboard charger, typically up to 11 kW on three-phase. The power factor at your meter depends on the vehicle’s onboard charger quality, not the wallbox itself. Some cheaper onboard chargers present power factors below 0.85, which is enough to trigger Eskom’s reactive energy penalty if you are on a Megaflex or WEPS tariff during the June-to-August high-demand season.
A DC fast charger is fundamentally different. The rectifier and active power factor correction circuitry live inside the charging station. The unit converts AC from the grid to DC internally and delivers high-voltage DC directly to the battery, bypassing the vehicle’s onboard charger entirely. This means charge times drop from hours to minutes, but it also means the unit draws large amounts of power from the grid in very short bursts. A 60 kW DC charger draws roughly 60 kVA at unity power factor. Two simultaneous sessions on a 200 kVA NMD site creates a 120 kVA EV load on top of existing building loads, and a single 30-minute integrating period above your NMD sets the month’s demand charge and starts a rolling 12-month excess capacity penalty.
“DC chargers have two purposes: speed and convenience, with current-gen chargers being able to handle 200 km in 20 minutes.”
Winstone Jordaan, MD of GridCars, South Africa’s largest public EV charging network operator.
Real installed costs: what you actually pay in South Africa
AC Level 2 commercial charging
A commercial AC Level 2 point costs roughly R25,000 per point installed for small-business projects in Gauteng, according to buildersingauteng.co.za’s 2026 cost guide. Multi-point projects (ten points or more at a shared civil trench) typically reduce that unit cost by 15 to 20 percent through bulk procurement and shared cable runs. Three-phase installations at 11 kW or 22 kW run R18,000 to R40,000 all-in with a Certificate of Compliance, reflecting the higher-capacity components and more complex wiring required.
The variables that move the number are: distance from the DB board to the charger (R500 to R2,000 per 10 metres of surface cable run; R2,000 to R5,000 per 10 metres of underground conduit), whether the existing DB board can carry the new load (a board upgrade costs R3,000 to R35,000 depending on complexity), and whether the site needs a three-phase connection upgrade. That upgrade alone costs R15,000 to R30,000 in Pietermaritzburg, R25,000 to R40,000 in Stellenbosch, and R40,000 to R80,000 in Sandton, where municipal approval, trenching, and transformer work are all required.
DC fast charging: the real site cost
Public DC fast-charging site costs are substantially higher. Greg Blandford, Director of Rubicon, was direct about the numbers at the Enlit Africa 2025 panel in Cape Town:
“Where the public charging infrastructure is concerned, the investment is quite high. So typically you start anywhere from a half million rand up to two million rand per site. We’ve got a 200 kilowatt DC charger at the Mall of Africa in Johannesburg. That site cost us about R2.5 million. We’ve got a site at Canal Walk in Cape Town, which is 150 kilowatt DC, that’s about R1.5 million.”
Greg Blandford, Director of Rubicon (110 publicly available charging stations), Enlit Africa 2025.
A single 47 kW DC charging setup runs R400,000 to R1,250,000 all-in for hardware and civil works (imotonews.co.za, March 2025). At the lighter end of DC, commercial DC fast-charger hardware in Gauteng starts from R50,000 and moves well above R200,000 for higher-output units (buildersingauteng.co.za). Add civils, trenching, protection, grid upgrades, and a formal load report (R3,000 to R6,000 from a consulting engineer, which is typically required for multi-point commercial sites), and the installed cost climbs quickly.
Summary cost table
| Charger type | Power | Hardware unit (excl. install) | Typical installed per point | Site total (multiple points) |
|---|---|---|---|---|
| AC Level 2 (single-phase) | 7.4 kW | R8,000 to R18,000 | R12,000 to R25,000 | Site-dependent |
| AC Level 2 (three-phase) | 11 to 22 kW | R44,918 to R63,414 (excl. VAT) | R18,000 to R40,000 | R20,000 to R25,000/point at scale |
| DC fast charger (entry) | 47 to 60 kW | R50,000 to R200,000+ | R400,000 to R1,250,000 | R500,000 to R2,000,000 per site |
| DC fast charger (high-power) | 150 to 200 kW | R676,419+ (excl. VAT) | R1,500,000 to R2,500,000 | R1,500,000 to R2,500,000 per site |
Sources: buildersingauteng.co.za 2026; ChargePoint SA 2026 cost guides; imotonews.co.za March 2025; ACDC.co.za commercial listings; ESI-Africa / Enlit Africa 2025. Installation costs vary by site: request an engineered site assessment for a fixed-scope price.
The tariff reality: what you pay per kWh matters more than capex
Capital cost is a one-time shock. Energy cost and demand charges are monthly, compounding, and directly linked to how well you manage your charging infrastructure. Fleet managers who focus only on the charger price tag routinely underestimate the five-year operating cost by a factor of two or more.
Depot charging versus public network rates
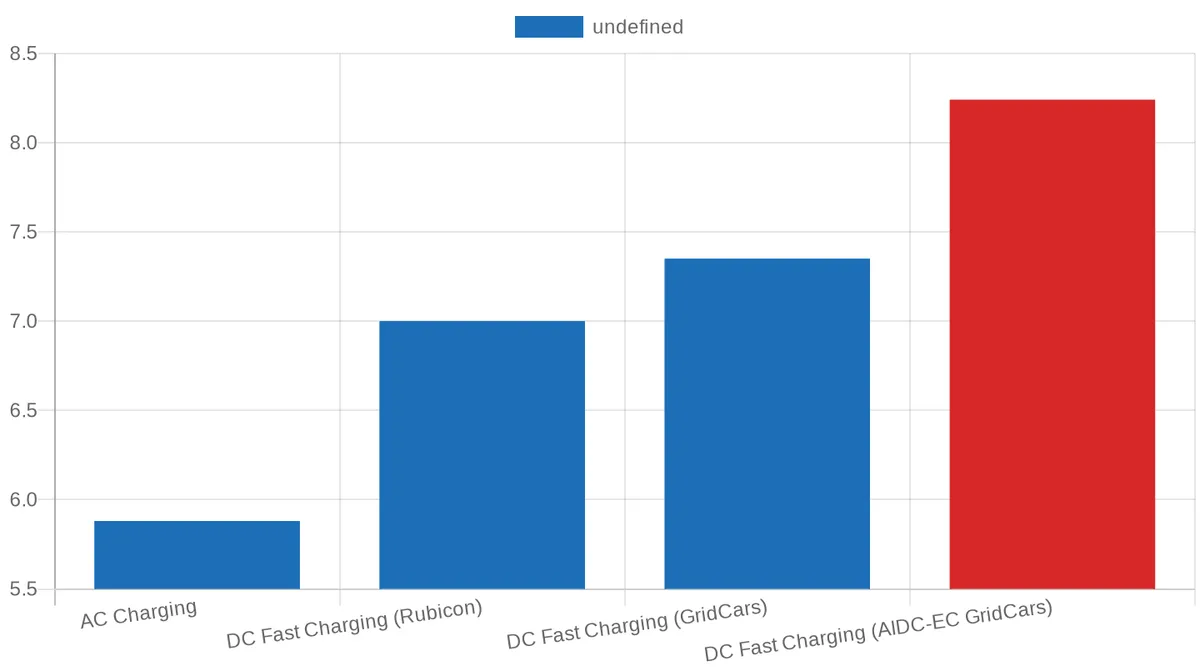
On-site depot charging costs approximately R4.50/kWh, according to Cartrack’s fleet analysis, which describes it as “the best route for your business.” That is less than half the public DC fast-charging rate. Public DC fast charging was R7.00/kWh on the Rubicon eMSP and R7.35/kWh on the GridCars eMSP as at August 2025 (Rubicon, official blog, August 2025). These rates increased by approximately 15% from 1 December 2025, so current 2026 public rates are higher. Public AC charging was R5.88/kWh on both networks as at August 2025, before the December increase.
The tariff gap widens further depending on which eMSP a driver uses. Hilton Musk, Head of E-mobility at Rubicon, explained the pricing structure clearly:
“Think of it like the fibre internet model. The fibre network providers sell bandwidth to internet service providers, who then add their margin before offering it to customers. Public EV charging works in much the same way.”
Hilton Musk, Rubicon Head of E-mobility, CleanTechnica, November 2025.
GridCars typically adds a 15% margin on top of the Rubicon wholesale CPO rate. At AIDC-EC stations, Rubicon eMSP customers pay R7.00/kWh while GridCars eMSP customers pay R8.24/kWh (Rubicon, August 2025). At R8.24/kWh, the cost advantage over petrol starts to narrow noticeably for higher-consumption commercial vehicles.
“It’s important to note that these tariffs are typically set through agreements between the charge point operator and the e-mobility service provider, which means they can vary in some cases. For example, at AIDC-EC charging stations, Rubicon eMSP customers pay R7.00 per kWh while GridCars eMSP customers pay R8.24 per kWh.”
Hilton Musk, Rubicon, August 2025.
There is currently no TOU or dynamic pricing at South African public charge points. As Musk noted: “Currently in South Africa, we only use flat rate tariffs.” This means CPOs must absorb the full cost of peak-period demand charges within a flat margin, which is one reason public DC fast-charging tariffs carry a structural premium over depot rates and are unlikely to fall soon.
The Eskom demand-charge trap for commercial sites
If you operate on Eskom’s Megaflex, WEPS, or a municipal bulk tariff, energy cost (R/kWh) is only part of your electricity bill. There are at least three separate kVA-denominated charges on top of energy: a Transmission network charge, a Distribution network capacity charge, and a Distribution network demand charge, all billed per kVA per month. From April 2025, a fourth layer, the Generation Capacity Charge (GCC), was phased in at 20% in 2025/26 and rises to 30% in 2026/27. The Megaflex network demand charge for FY26/27 is R52.65/kVA/month during the high-demand season (June to August) and R26.29/kVA/month outside it. These charges are billed whether or not anyone charges a vehicle.
Maximum demand is measured per 30-minute integrating period (Eskom Schedule of Standard Prices 2025/26). A single EV charging spike, even one that lasts 35 minutes, can set the month’s demand charge. Worse, NMD exceedances accumulate over a rolling 12-month period. As Eskom’s own advisory material states: “This is calculated by multiplying the amount exceeded (kVA) above your NMD by the number of months you have exceeded it over a rolling 12-month period.” One spike can cost you for up to a year.
A 150 kW DC fast charger draws approximately 150 kVA at unity power factor. Two simultaneous sessions on a site with a 200 kVA NMD creates a 300 kVA spike, which is 50% above the NMD, and that exceedance triggers the rolling 12-month excess capacity charge immediately. AC chargers create smaller, more predictable load increments that are far easier to keep within NMD headroom, particularly when managed by a smart load-balancing controller.
The power factor angle is less obvious but equally real. Eskom levies a reactive energy charge when power factor falls below 0.96 (i.e. reactive energy exceeds 30% of kWh) during peak and standard periods in the June-to-August high-demand season. Some cheaper EV onboard chargers present power factors below 0.85. Alpha Power Solutions, a South African energy advisory, has documented that PF penalties can increase a commercial electricity bill by 10 to 25%, and they are not always itemised clearly on the invoice. As they note: “Many businesses are shocked to learn how much they’re losing without even realising it.”
“Many businesses are shocked to learn how much they’re losing without even realising it.”
Alpha Power Solutions, South African energy advisory, on commercial power factor penalties.
DC fast chargers with active PFC circuitry built in tend to present better power factor to the grid than AC EVSEs connected to vehicles with poorly corrected onboard chargers, which is one technical argument in their favour for sites already on bulk tariffs with PF exposure. But the larger demand-charge risk from DC units almost always outweighs this benefit unless charging is tightly managed.
Cost-of-ownership comparison: AC depot versus DC depot versus public network
| Scenario | Capital cost (indicative) | Energy cost (kWh) | Demand-charge risk | Payback driver |
|---|---|---|---|---|
| AC depot (10 x 22 kW, managed) | R200,000 to R400,000 | ~R4.50/kWh | Low (load balancing keeps within NMD) | Fuel saving vs petrol/diesel; low capex |
| DC depot (dual-gun 60 kW, managed) | ~R650,000 all-in (illustrative) | ~R4.50/kWh | High unless NMD headroom confirmed; ~R3,300/mo demand charge | Speed (high vehicle turnover); ~1.2-yr payback at ~350 kWh/day captive fleet |
| Public DC (commercial CPO site) | R500,000 to R2,500,000 | R7.00 to R8.24/kWh (Aug 2025; higher post Dec 2025) | Very high; fixed demand charge regardless of utilisation | Requires ~100,000 EVs on SA roads for real profitability (Jordaan, GridCars) |
| Public AC (commercial CPO site) | R500,000 to R2,000,000 per site | R5.88/kWh (Aug 2025; higher post Dec 2025) | Moderate; lower power draw but still fixed demand component | Dwell-time dependent (shopping centres, hotels); amenity value |
Tariff figures dated where applicable. Demand charges and energy costs are site-specific. The DC depot payback illustration is indicative only; actual payback depends on utilisation, tariff structure, and NMD headroom. Request an engineered site assessment for project-specific numbers.
The DC depot case makes commercial sense when utilisation is high and the site is captive. The WattSpot fleet network run by Aeversa in Gauteng is a real proof of concept: 18,884 sessions dispensing 205,845 kWh across three sites between December 2025 and February 2026, supporting 2 million kilometres of commercial driving. The chargers are 60 kW DC units; vehicles currently draw a maximum of 20 kW per session, which means the infrastructure is sized for growth, not just today’s fleet.
“The whole goal of WattSpot is to stabilise the most unpredictable variable in fleet operations: whether a vehicle can charge when it needs to. 18,884 sessions across 3 sites gave us the route data to know exactly where the next chargers need to go. We are not guessing at expansion. The data builds the roadmap.”
Reando Potgieter, COO of Aeversa, Engineering News, April 2026.
The Valternative Energy spokesperson supporting 240 Uber EVs on the same network was equally clear on what reliability means operationally: “WattSpot enables us to significantly reduce vehicle downtime, improve driver earnings, and deliver a seamless, high-performance experience for our fleet.”
The public charging business case: honest about the numbers
If you are considering a public-access DC fast charging site as a revenue stream, the numbers require careful scrutiny. Larissa Venter, Chief Stakeholder Officer at Zero Carbon Charge, was blunt at Enlit Africa 2025:
“If you go into EV charging, it’s not to make revenue.”
Larissa Venter, Chief Stakeholder Officer at Zero Carbon Charge, Enlit Africa 2025.
Winstone Jordaan of GridCars framed the threshold precisely: “There’s just no business case. We need about 100,000 vehicles on the road before any of us will see real profitability.” South Africa’s cumulative passenger EV market reached only 3,543 vehicles by end of 2024 (GreenCape Electric Vehicles Market Intelligence Report 2025). The gap between current fleet size and the 100,000-vehicle profitability threshold is still very large, and low utilisation means fixed demand charges and NMD costs are spread across very few kWh sold per month, wrecking unit economics.
This does not mean public charging sites have no value. Dwell-time businesses (hotels, shopping centres, office parks) can justify AC Level 2 charging as an amenity that drives footfall and tenant retention rather than as a direct revenue line. But anyone modelling a DC fast charging site purely as a profit centre against today’s utilisation numbers should build a conservative scenario with the demand charges in the model from day one.
Understand demand charges and load management for your EV site
Grid resilience and the South African operating environment
South Africa averages one power outage per day (Ampcontrol case study, Aeversa, 2025). For AC chargers at a managed depot, a well-designed UPS or solar-plus-battery buffer can maintain charging through most outages. For a high-power DC fast charger drawing 100 kW or more, islanding from the grid requires a significantly larger battery installation.
Some operators have taken this further. CHARGE, the South African DC fast-charging CPO, operates entirely off-grid:
“Being totally self-sufficient in power, with on-site energy production, our rates are predictable and controlled and not subject to Eskom tariff hikes or loadshedding.”
CHARGE South African DC fast charging CPO, on their solar-plus-battery model.
BYD’s planned Flash charging rollout (200 to 300 megawatt-level stations by end of 2026, per BYD Vice-President Stella Li) explicitly lists grid capacity as the gating constraint for non-solar sites: “Not all the sites will be solar powered, especially where there is sufficient grid capacity already available, but having solar as an option will allow BYD to build infrastructure outside the main urban centres.” Grid capacity, not EV demand, is the primary deployment bottleneck for high-power DC charging in South Africa right now.
For fleet managers, the practical implication is that DC fast chargers at sites without existing high-capacity grid connections will require substantial and expensive grid upgrades, adding meaningfully to the site cost and timeline. AC depot chargers with managed load control and a battery buffer are often the more resilient and faster-to-deploy choice in the South African grid environment.
Reliability: the gap between reported uptime and real-world performance
Charger reliability deserves its own section because the numbers are worse than most operators expect. ChargerHelp! analysed more than 100,000 sessions across 2,400 chargers and found that while networks report 98.7 to 99.9% uptime, the actual first-time charge success rate (FTCSR) is only 71%. More than one in four charging attempts fails on chargers that appear operational. FTCSR at new stations averages 85% and drops below 70% by year three.
“Uptime tells us if a charger is available, but it doesn’t tell us if a driver can actually plug in and get a charge on the first attempt. First-time charge success captures the real driver experience.”
Kameale Terry, CEO of ChargerHelp!, commenting on the company’s 2025 EV Charging Reliability Report.
DC fast chargers have substantially more failure modes than AC wallboxes: power modules, cooling systems (fan motor replacement costs USD 150 to 400; liquid cooling repairs can exceed USD 1,000), cable assembly wear (USD 300 to 800 per DC cable replacement), screens, payment systems, and software. Grid voltage shifts, which are common in South Africa, can cause power electronic converters to shut down entirely (Oak Ridge National Laboratory). The BUSCMMS fleet maintenance platform puts it plainly:
“The dirty secret of EV fleet operations is that charger reliability often lags far behind vehicle reliability. When chargers have problems, every vehicle assigned to those chargers becomes a stranded asset. The ripple effects cascade through your entire operation.”
BUSCMMS commercial fleet maintenance platform analysis, 2026.
South Africa’s public network shows these reliability issues too. A poll of the South African EV owner community reported by Tech-Brunch found that 46% of respondents reported unresolved problems, 31% experienced problems that were eventually fixed, and only 23% reported smooth experiences. AC wallboxes, by contrast, have far fewer moving parts and lower component complexity, making them substantially more reliable per session over a ten-year fleet lifecycle.
Winstone Jordaan’s warning at Enlit Africa 2025 applies directly here:
“You’ve got to stop the installation of dumb chargers. You need smart, connected chargers to avoid what happened in the UK, where they had to ban 200,000 dumb units after rollout. We have the chance to get it right from the start.”
Winstone Jordaan, Director of GridCars, Enlit Africa 2025.
Whether you choose AC or DC, the charger must be OCPP-connected, remote-manageable, and supported by a maintenance contract. Non-connected chargers cannot participate in load management, cannot be remotely diagnosed, and will become a liability as the industry matures.
Battery health: the long-term cost DC charging introduces
Fleet operators running on tight vehicle replacement cycles sometimes underestimate the battery degradation cost of frequent DC fast charging. Geotab’s research on fleet DC charging strategy, published January 2026, is clear:
“For fleets, the focus should be balance. Using the lowest charging power that still meets operational needs can make a measurable difference to long-term battery health without limiting vehicle availability.”
Geotab research spokesperson, January 2026.
For overnight depot charging, where vehicles park for six to ten hours, there is rarely an operational justification for DC fast charging. A 22 kW three-phase AC charger will fully charge a 60 to 80 kWh commercial EV overnight. DC fast charging at a depot makes sense when turnaround time between shifts is under 90 minutes, when route requirements are variable and occasionally longer than overnight charging can cover, or when the depot is running a high vehicle-to-charger ratio and throughput is the binding constraint. Outside those scenarios, the higher capital cost, higher demand-charge risk, greater maintenance complexity, and battery wear of DC fast charging make AC the operationally sound choice for most South African fleet depots.
Compliance: what South African law requires on every site
Every EV charger installation in South Africa, regardless of size, must comply with SANS 10142-1 (the Low-voltage Wiring Installations code), including the 2025 update’s Annex N, which specifically covers EV charging infrastructure. Annex N mandates a dedicated circuit, a Type A or Type B RCD rated for DC residual currents, a minimum 6mm2 cable for 32A runs under 25 metres, and a surge protection device. AC connectors must conform to SANS 62196-2; DC connectors must conform to SANS 62196-3. Every completed installation requires an electrical Certificate of Compliance (CoC), and all work must be carried out by an ECSA-registered installer.
The CoC cost ranges from R500 to R1,500 for most commercial sites; in Pretoria, where commercial sign-off is more complex, R2,000 to R4,000 is typical. Skipping the CoC or using an unlicensed installer carries penalties of R20,000 or more, voids insurance for any electrical fire, and prevents the property from being legally transferred. A formal load report from a consulting engineer is typically required for multi-point commercial sites and costs R3,000 to R6,000.
For body corporate or sectional title properties, an ordinary resolution (more than 50% of owners) is sufficient to install a charger on common property. Exclusive-use-area charging rights are real rights under STSMA Section 27, distinct from personal rights under Sections 10(7) and (8). Any installer or advisor claiming a 75% special resolution is required is citing a refuted legal position.
Our recommended approach for commercial sites
ChargePoint SA’s Commercial EV Charging Programme is the approach we recommend for fleet operators, logistics companies, hotels, office parks, and commercial property managers. It is a single accountable contract covering charger supply, certified installation, and full compliance, with one point of contact from site survey to CoC sign-off. All installations are carried out by ECSA-registered installers under SANS 10142-1, with SANS 62196-2 and SANS 62196-3 compliant connectors. This is the trust signal that most competitors omit from their proposals and is the reason procurement managers choose a structured programme over a hardware-only quote.
Four ownership models are available to match your site’s risk appetite: the business buys the infrastructure outright, a revenue-share arrangement, an investor-funded model, or ChargePoint SA owns the infrastructure and the host receives charging at no capital cost. Billing can be directed to the business or to end users, depending on what your procurement and finance teams need.
We supply and install a range of quality commercial chargers. For sites with existing Victron solar and battery systems, the Victron Energy EV Charging Station (7.4 kW) integrates natively with Victron ESS for solar-surplus charging and includes a 4.3-inch touchscreen with WiFi app control. For outdoor-mounted applications where a tethered, IP55-rated unit is preferable, the FoxESS L07P (7.3 kW) with its built-in 5-metre Type 2 cable is a practical, cost-effective choice. Both are priced at R9,100 and R9,900 respectively for the charger unit; installation is quoted per site because cable run length, DB board condition, and civil requirements vary. These are the two we recommend most for light commercial applications, though we can supply and install other quality chargers on request. For multi-point commercial depots and higher-power applications, contact us for a project-specific proposal.
Frequently asked questions
What is the difference between AC and DC charging for a commercial fleet depot in South Africa?
AC Level 2 chargers (7.4 to 22 kW) pass alternating current to the vehicle and rely on the car’s onboard charger for conversion. They are lower cost to install (from roughly R25,000 per point), have fewer failure modes, and create manageable load increments that a smart controller can keep within your site’s NMD. DC fast chargers (50 kW and above) convert AC to DC internally and charge batteries directly, cutting charge times to 20 to 45 minutes for most commercial EVs. They cost R400,000 to R2,500,000+ per site all-in, carry significantly higher demand-charge risk on Eskom Megaflex or WEPS tariffs, and require more intensive maintenance. For most overnight depot operations, AC Level 2 is the economically sound choice. DC fast charging is justified when shift turnaround time is under 90 minutes or vehicle throughput is the binding constraint.
How do Eskom demand charges affect DC fast charging at a commercial site?
Eskom measures maximum demand in kVA over each 30-minute integrating period, and a single spike above your Notified Maximum Demand (NMD) triggers an excess capacity charge that accumulates over a rolling 12-month period. A single 150 kW DC fast charger draws approximately 150 kVA. Two simultaneous sessions on a 200 kVA NMD site pushes the EV load alone to 300 kVA before any other building load is counted. The Megaflex network demand charge for FY26/27 is R52.65/kVA/month during the high-demand season (June to August). An unmanaged DC charger installation that breaches NMD by 100 kVA for a single month can cost an additional R5,265 in demand charges for that month alone, with a penalty tail running up to 12 months. Smart load management and an engineered NMD review before installation are not optional extras; they are a financial necessity.
What compliance documents does a commercial EV charger installation in South Africa require?
Every installation, regardless of size, requires a Certificate of Compliance (CoC) issued under SANS 10142-1 (the Low-voltage Wiring Installations code), including Annex N for EV charging circuits. AC connectors must comply with SANS 62196-2; DC connectors with SANS 62196-3. All electrical work must be carried out by an ECSA-registered installer. Multi-point commercial sites typically also require a formal load report from a consulting engineer (R3,000 to R6,000). Skipping the CoC voids your insurance for electrical fires, carries fines of R20,000 or more, and prevents property transfer. When comparing quotes, always confirm that the installer will issue a CoC and is registered with ECSA: many hardware-only suppliers do not.
What does on-site depot charging actually cost per kWh compared with public fast charging?
On-site depot charging at a commercial premises costs approximately R4.50/kWh based on Cartrack’s fleet cost analysis, reflecting commercial municipal electricity tariffs. Public DC fast charging was R7.00/kWh (Rubicon eMSP) to R8.24/kWh (GridCars eMSP at AIDC-EC stations) as at August 2025; those tariffs increased by approximately 15% from 1 December 2025. Public AC charging was R5.88/kWh on both major networks as at August 2025, also subject to the December increase. Depot charging at R4.50/kWh is substantially cheaper than public rates, which is why fleet operators with overnight parking should prioritise their own infrastructure rather than depending on the public network for regular charging.
Is a public DC fast charging site a viable revenue stream for a South African property owner in 2026?
Honestly, at current EV fleet size, the business case for public DC fast charging as a standalone revenue stream is very weak. Winstone Jordaan, Director of GridCars (South Africa’s largest public charging network), stated at Enlit Africa 2025 that approximately 100,000 EVs need to be on South African roads before real profitability is achievable. South Africa’s cumulative passenger EV fleet reached only 3,543 vehicles by end of 2024 (GreenCape, 2025). Low utilisation means fixed demand charges and NMD costs are spread across very few kWh sold per month, resulting in high per-kWh breakeven costs. Dwell-time businesses (hotels, shopping centres, office parks) can justify AC Level 2 charging as a footfall and tenant-retention amenity. A DC fast charging investment as a primary revenue play requires a clear utilisation case and a demand-charge management strategy from day one.
What smart charging features should a South African fleet operator require from a commercial charger?
At minimum, every charger should be OCPP-connected (Open Charge Point Protocol), support remote monitoring and diagnostics, and integrate with a load-management controller that can cap total site demand within NMD limits. Winstone Jordaan of GridCars warned directly at Enlit Africa 2025 that South Africa must avoid the UK’s mistake of deploying 200,000 non-connected dumb chargers that had to be banned after rollout. RFID or app-based access control is important for fleet cost allocation and fraud prevention. For sites with solar, a charger that can accept an external load signal (or integrate natively with your inverter’s ESS system) enables solar-surplus charging, reducing your grid draw and tariff exposure further. The Aeversa WattSpot network achieved above 98.5% uptime at its Gauteng DC fleet depots using Ampcontrol charging management software, demonstrating what is achievable with the right software layer in place.
The right next step
If you manage a fleet, operate a logistics depot, or are responsible for EV charging infrastructure at a commercial property, the single most valuable thing you can do right now is get an engineered site assessment that quantifies your NMD headroom, calculates the all-in installed cost for your specific site, and produces a realistic payback model before you commit capital. Get your free commercial charging site plan from ChargePoint SA: tell us your site, your fleet size, and your operational hours, and we will come back with a recommended charger specification, a fixed-scope cost, and a payback projection, at no charge and with no obligation.
Plan your commercial AC vs DC charging site for maximum ROI
The free Site Builder models depot vs fast-charging payback with real South Africa costs.
Model my site’s ROI →WhatsApp us
CoC-certified installers, nationwide