Key points
- The CHARGE N3 Roadside station (Reitz Interchange, Free State), launched 19 May 2026, is South Africa’s most powerful public charging hub: three DC chargers with six dispensers plus two AC chargers, serving up to eight vehicles simultaneously, backed by R100 million from the Development Bank of Southern Africa.
- At a target 30 minutes for 20-80% charge, the N3 stations match mid-tier European fast-charging speeds, though individual cars are capped by their own on-board limits.
- CHARGE’s pilot at Wolmaransstad (N12) has achieved 99% uptime since its November 2024 launch, far above the GridCars network average where a poll found only 23% of users reported smooth experiences.
- Public DC fast-charging rates were R7.00-R7.35/kWh as of August 2025; a circa 15% GridCars tariff increase took effect 1 December 2025, so current 2026 public DC rates are higher than those benchmarks.
- Home charging at R3.00-R4.00/kWh is 75-140% cheaper than public DC fast charging; 95% of South African EV owners use home charging as their primary method.
- South Africa has roughly one charge point for every seven EVs on the road, but Gauteng and the Western Cape hold 80% of those charge points, leaving long corridors unserved.
Why the CHARGE N3 stations matter
On 19 May 2026, South Africa’s most powerful public fast-charging hub opened at the Reitz Interchange on the N3 in the Free State. The following day, a second sister site, CHARGE N3 Tugela, opened at the Colenso-Winterton Interchange in KwaZulu-Natal, as reported by Engineering News. Together they mark a step-change in South African EV infrastructure, because for the first time a corridor hub is designed around the physics of modern fast-charging rather than the grid constraints of a shopping mall car park.
Both stations are fully off-grid and solar-powered, a direct response to years of load-shedding that have hobbled grid-tied public chargers. The R100 million investment from the Development Bank of Southern Africa signals that government-backed capital is now flowing into EV infrastructure, not just into the vehicles themselves.
What the CHARGE N3 station can actually do
Each N3 station is built around three DC chargers with six dispensers and two AC chargers, allowing up to eight EVs to charge simultaneously. The operator, Zero Carbon Charge (CHARGE), states that most EVs can charge from 10% to 80% in approximately 25 minutes at these sites.
The Wolmaransstad pilot on the N12, which preceded the N3 expansion, gives the clearest performance picture. That site runs six DC fast chargers delivering over 700 kW combined output, a 546 kWh liquid-cooled battery, and 480 bifacial solar panels providing up to 280 kW of electricity. Its peak single-charger rating reaches 248 kW, the fastest in South Africa as of May 2025. Critically, the Wolmaransstad site has recorded 99% uptime since November 2024, which is a meaningful number when the grid-tied alternative is a GridCars network where 46% of users in a MyBroadband poll reported unresolved problems.
| Spec | CHARGE N3 (Reitz / Tugela) | CHARGE Wolmaransstad (N12 pilot) |
|---|---|---|
| DC charger units | 3 chargers, 6 dispensers | 6 DC fast chargers |
| Combined DC output | Not publicly disclosed | 700 kW+ |
| Peak single-charger output | Not publicly disclosed | 248 kW |
| AC chargers | 2 × Type 2 | Not specified |
| Solar array | Off-grid solar (capacity not disclosed) | 280 kW (480 bifacial panels) |
| Battery storage | Not publicly disclosed | 546 kWh liquid-cooled |
| Simultaneous vehicles | 8 | Not specified |
| Uptime (reported) | Not yet reported | 99% since Nov 2024 |
| Typical 10-80% charge time | ~25-30 minutes | ~25 minutes |
What it costs to charge here, and at home
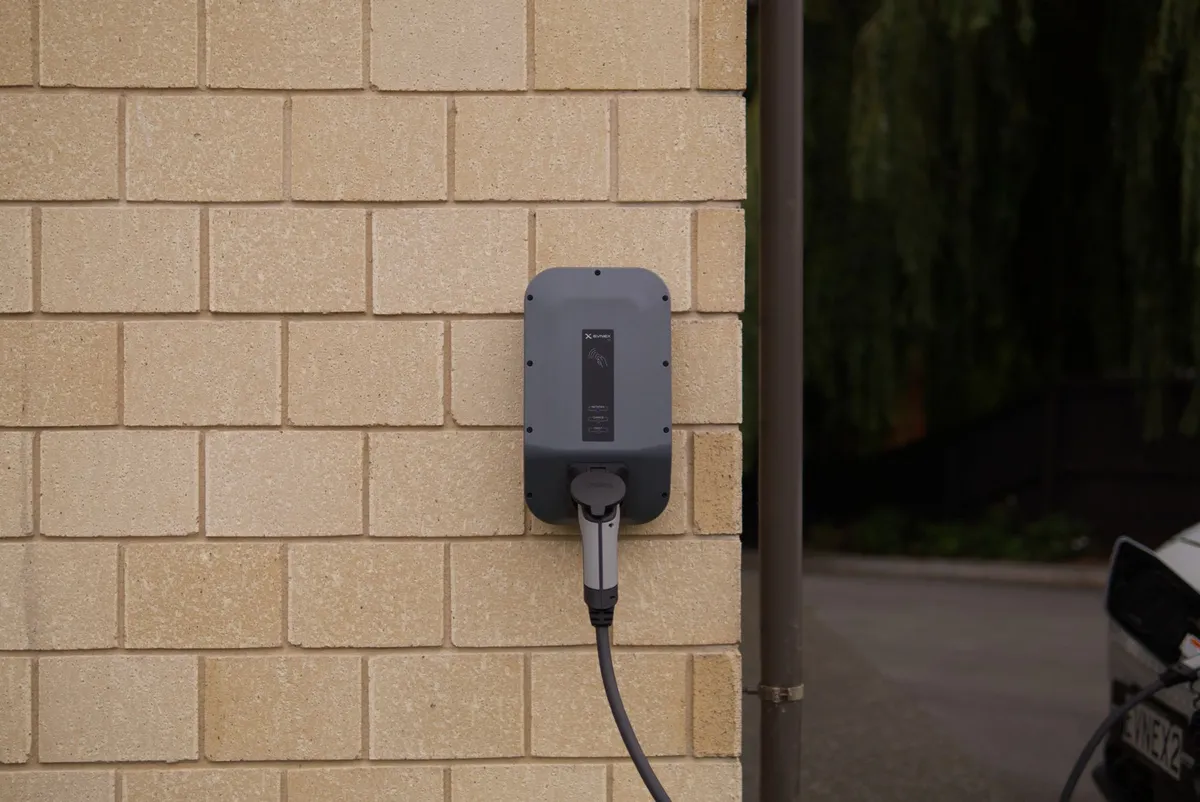
The N3 stations are off-grid and solar-powered, so tariffs may differ from the grid-tied public network. As a reference point, standard public DC fast-charging rates across South Africa were R7.00/kWh (Rubicon eMSP) and R7.35/kWh (GridCars eMSP) as of August 2025. GridCars implemented a circa 15% tariff increase from 1 December 2025, so current 2026 rates are higher than those benchmarks. At the premium end, BMW Menlyn branded charging has been recorded at up to R11.76/kWh.
Home charging tells a very different story. At Johannesburg City Power rates of R1.79-R2.39/kWh, the effective cost per 100 km for a typical EV consuming 15 kWh/100 km is R37-R60 at home, versus R105-R110 at R7.00-R7.35/kWh public DC rates. Over a typical month of 1,200 km, that gap translates to R378-R767 in monthly savings for the driver who charges at home. It is no surprise that 95% of South African EV owners rely on home charging as their primary method.
| Network / operator | Charging type | Rate per kWh |
|---|---|---|
| Rubicon eMSP | DC fast | R7.00 |
| GridCars eMSP | DC fast | R7.35 (+ ~15% from Dec 2025) |
| Rubicon / GridCars eMSP | AC | R5.88 |
| BMW Menlyn (OEM branded) | DC fast | Up to R11.76 |
| Johannesburg City Power (home) | Home AC | R1.79-R2.39 |
If you are planning a home charger installation to avoid public charging tariffs, get a free installation quote and lock in the savings before public rates climb further.
Plan a national EV charging network for your fleet
How SA compares to global benchmarks
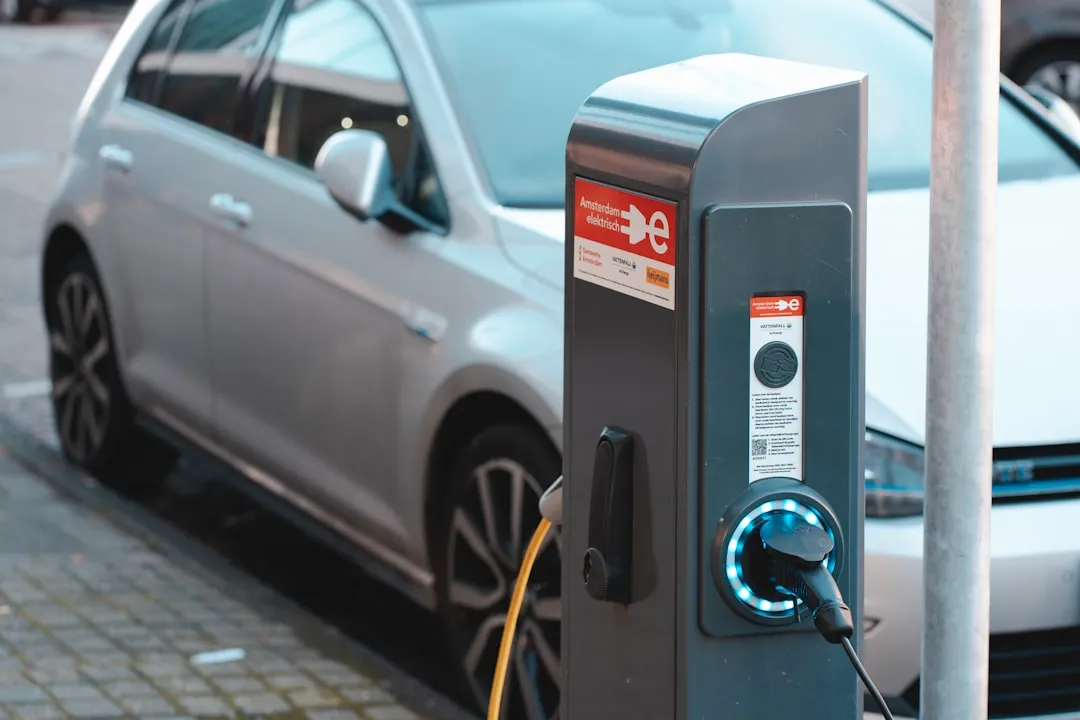
South Africa had approximately 445 public charging sites with 650 chargers and 1,200+ connectors as of early 2026, up from roughly 200 stations in 2022, a 122% increase in three years. GridCars operates around 60% of that capacity. EV24 Africa estimates approximately 600 public charging stations were operational by late 2025.
The EV-to-charger ratio sits at roughly 1:7, meaning there is one publicly accessible charge point for every seven EVs registered. That ratio is numerically healthy compared to the global 1:10 benchmark. The problem is geography: Gauteng and the Western Cape hold 80% of those charge points, while a 300 km gap persists between Beaufort West and Three Sisters on the N1, one of the country’s most-driven long-distance routes.
In Germany, home charging costs €0.24-€0.38/kWh (roughly R4.50-R7.10 at current exchange rates), while public DC fast charging in the USA runs $0.43-$0.68/kWh with an additional 30-40% peak-hour surcharge and idle fees of $0.40-$1.00 per minute after charging completes. South Africa’s absence of idle fees and session charges is a genuine consumer advantage at this stage of market development, though that is unlikely to last as networks chase profitability.
The profitability threshold for SA charging operators is estimated at approximately 100,000 EVs on the road. South Africa had roughly 7,000-10,000 EVs by end-2025, including brands that do not report to the official register. South Africa recorded 16,716 new energy vehicle sales in 2025, representing 4% of total new vehicle sales and 7.1% year-on-year growth. The Rubicon network processed 21,606 charging transactions in 2025, up 159% from 8,338 in 2024, demand is growing fast even if the absolute numbers remain small.
What is coming next: BYD Flash and the CHARGE national rollout
Two expansions will reshape the SA public charging map before the end of 2026. First, BYD plans to install 200-300 Flash charging stations delivering up to 1,000 kW, enough to recover 400 km of range in 5 minutes on compatible vehicles (CLTC cycle). Construction was scheduled to begin in April to May 2026. If that target is met, BYD’s rollout alone could more than double the country’s public charger count.
Second, CHARGE has announced 120 solar-powered off-grid stations planned nationally, spaced 150 km apart on major roads. The N3 launch covered by a R100 million DBSA investment is the first major deployment in that rollout. The CHARGE N3 stations delivered 7,470 kWh of off-grid solar energy in their first month of operation, confirming that demand at corridor sites is real.
The government has also implemented a 150% tax deduction for EV production investments effective 1 March 2026, which lowers the capital cost for manufacturers and infrastructure investors alike.
Reliability: the number that matters more than peak power
Peak power figures make headlines, but uptime is what a driver actually experiences. The Wolmaransstad pilot’s 99% uptime since November 2024 is the current benchmark for SA off-grid solar stations. Compare that to the grid-tied public network: 46% of EV owners in a MyBroadband poll reported unresolved GridCars charger problems, with only 23% reporting consistently smooth experiences. GridCars suffered a widespread network glitch in early May 2026 affecting multiple platforms, and two sites, Alzu near Emalahleni and Mooirivier Mall in Potchefstroom, have been confirmed as long-term offline.
The root causes are familiar: load-shedding, grid constraints, ageing hardware, and maintenance thresholds that are not funded at the same rate as new installations. The CHARGE off-grid model sidesteps the grid-constraint issue entirely. WattSpot’s fleet charging network in Gauteng sustained above 98.5% uptime across 18,884 charging sessions (205,845 kWh dispensed) between December 2025 and February 2026, using real-time monitoring and WhatsApp-based technical support, demonstrating that high uptime is achievable, but only with active management.
No South African airport operator, ACSA, BMW, or GridCars has published uptime percentages, fault rates, or payment failure rates for public charging sites. Until they do, the 99% CHARGE figure and the 98.5% WattSpot figure are the only publicly verified benchmarks in the market.
What this means for your business or fleet
If you operate a fleet depot, a hotel, a mall, or any commercial site generating captive daily EV demand, the N3 stations validate the economics of owning your own charging infrastructure. A dual-gun 60 kW DC site costs roughly R650,000 all-in; at captive fleet depot utilisation of around 350 kWh per day, payback can reach approximately 1.2 years at an IRR of around 80%. At low utilisation the numbers look very different, which is why a proper site assessment matters before committing capital.
Plan your site free with our Commercial Site Builder, enter your site details and get a recommended charger, estimated cost, and payback period. Then book an engineered site assessment with ECSA-registered installers who deliver a single accountable contract: charger supply, SANS 10142-1 certified installation, and electrical CoC.
Frequently asked questions
How long does it take to charge at the CHARGE N3 stations?
CHARGE states that most EVs can charge from 10% to 80% in approximately 25 minutes at their ultra-fast DC chargers. A typical 20-80% session takes around 30 minutes, though the actual time depends on the vehicle’s on-board charger limit and battery size.
How much does public DC fast charging cost in South Africa?
As of August 2025, Rubicon eMSP charged R7.00/kWh and GridCars eMSP charged R7.35/kWh for DC fast charging. GridCars implemented a circa 15% increase from 1 December 2025, so current 2026 rates are higher. AC public charging was R5.88/kWh on both networks.
Are the CHARGE N3 stations off-grid?
Yes. Both the Reitz Interchange and Colenso-Winterton stations are solar-powered and off-grid, meaning they are not affected by load-shedding or Eskom grid constraints. The Wolmaransstad pilot used the same approach and recorded 99% uptime since its November 2024 launch.
How does South Africa’s charging network compare globally?
South Africa had approximately 445 public charging sites with 650 chargers and 1,200+ connectors as of early 2026. The EV-to-charger ratio is roughly 1:7. The key gap is geographic, 80% of charge points are in Gauteng and the Western Cape, leaving long rural corridors underserved.
What EV charging standards apply in South Africa?
South Africa uses SANS 62196-2 for AC connectors and SANS 62196-3 for DC connectors. All installations must comply with SANS 10142-1 (the wiring code), be completed by an ECSA-registered installer, and be accompanied by an electrical Certificate of Compliance (CoC).
Compare your home charging cost against N3 public rates
See how R7.35/kWh public rates stack against your home tariff.
Calculate my home cost →WhatsApp us
CoC-certified installers, nationwide